Subscribe to receive top agriculture news
Be informed daily with these free e-newsletters

If the month-on-month change in forecasted cotton ending stocks gets tighter, we would expect to see prices in the short term adjust higher.
May 28, 2014
In a previous column I mentioned that the cotton market has some major, predictable milestones. The May supply/demand forecast by USDA is one of those milestones, as it marks the first of the fifteen monthly forecasts by USDA of production, consumption, exports, and ending stocks for the 2014 cotton crop. Fundamentally speaking, if the forecasted ending stocks are greater than those for the 2013 crop, we would expect lower prices relative to last year. That increasing heaviness year-over-year is the situation we are facing.
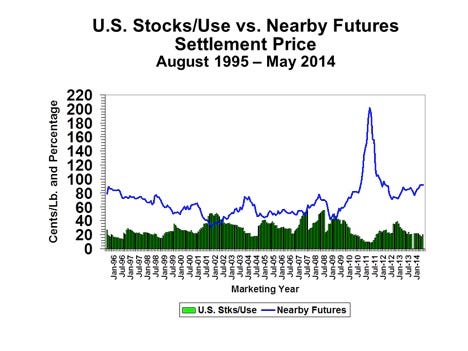
But these market reports also provide updated monthly information to that picture. If the month-on-month change in forecasted ending stocks gets tighter, we would expect to see prices in the short term adjust higher. The chart below demonstrates the effect on price of updated monthly forecasts. As those green bars move higher (i.e., higher ending stocks to use) or lower, that provides a fundamental reason for fluctuations in cotton futures. That is the basic supply-and-demand explanation of why prices move the way they do.
The May supply/demand report for U.S. cotton gave us an example of a revised expectation. Earlier in the year, USDA had projected a 16-million bale U.S. cotton crop for 2014. Based on that, I was expecting forecasted ending stocks for the 2014 U.S. crop to be roughly double those for the 2013 crop. That made me think that new crop cotton futures would range from the low/mid 70s to mid-80s.
But the May supply/demand report came in as a tighter picture for ending stocks. USDA’s projected U.S. cotton supply/demand balance sheet sees only 14.5 million bales of production, 9.7 million bales of exports, and 3.9 million bales of ending stocks. I particularly found it a little bold of USDA to start off forecasting over 20 percent abandonment, but there it is. Perhaps it is not so bold considering the drought monitor. Taking the forecasted ending stocks number, I would now have to raise my projected price range by at least a nickel, putting the low of the range around 75 cents for December 2014, with upside potential into the upper 80s.
A lot of the story is left to unfold. I think the U.S. planted acreage number will be higher than USDA’s forecast of 11.1 million acres, but then the abandonment rate may simply rise too. The planted acreage number will be more accurately measured by the end of June. As mentioned in an earlier column, the possible early arrival of El Niño moisture could mitigate some of the drought impact to the 2014 crop. Then we’ll have to wait for the monthly production estimates in August and September.
Anticipation of any changes to the stocks-to-use forecast may cause the futures market to adjust prior to these reports. So if growers are considering entering futures and options positions as a hedge, or are managing existing positions, they keep these benchmarks in mind while paying attention to emerging issues.
However, just like any road trip, there are uncertainties along the way. USDA and I will adjust our monthly forecasts with new information as it comes in. The remaining milestones include the June 30 Planted Acreage report and USDA’s cotton production estimates in August and September. The latter are based on field sampling of squares and bolls, and will set the benchmark for market expectations about abandonment, yield per harvested acre, and new crop production.
These benchmark reports are the most predictable influences on the cotton market, just like a road map. The new crop production information will be anticipated and (if it is a surprise) perhaps reacted to with either rallies or sell-offs. Readers should note that in years like this one where the expected ending stocks are greater than those for the previous crop, the seasonal pattern of price weakness usually kicks in after the August/September reporting period. At any rate, your plan for entering, exiting, or managing futures and options positions should also anticipate these milestones.
Sometimes road trips can still have unexpected delays from traffic or flat tires or engine trouble. The big variables for the 2014 cotton market include 1) Chinese import demand, 2) the South Plains drought conditions, and 3) the incidence and timing of El Niño conditions on rains in the U.S. and drought in India/Australia. These uncertainties are obviously somewhat intertwined. The strongest price scenario would result from no Chinese policy surprises and a U.S. crop below 16 million bales. The most bearish price outcome would be from a U.S. crop over 16 million bales and U.S. exports below 10 million.
You May Also Like
Enter a zip code to see the weather conditions for a different location.


