The pattern was obvious in a cornfield Dave Nanda spotted on the way to look at the Corn Watch field in 2020. It was confusing, yet obvious. It begged for a follow-up.
What made this pattern unusual was that it reversed itself halfway through the field, Nanda says. He is director of genetics for Seed Genetics Direct, sponsor of Corn Watch ’21, and the main consultant who observes the Corn Watch field. The goal is to learn things through observations in the Corn Watch field that help you make more informed decisions on your fields.
Related: Why some pull leaf samples at pollination
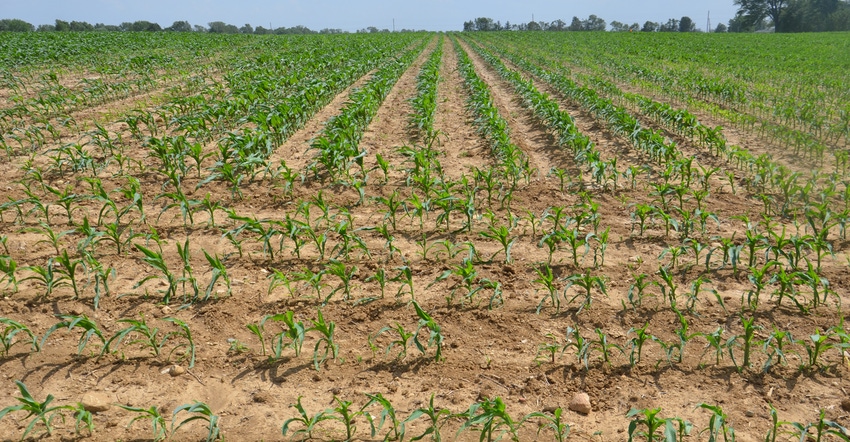
Seeing the same pattern in another field in 2020 was a bonus. Rows ran north and south, but the pattern ran diagonally at about a 30-degree angle from one end of the field to the other. The pattern consisted of two streaks of slightly shorter plants that were yellowish-green instead of dark green. At the halfway point, the pattern flipped — still running diagonally but in the opposite direction.
Was it from combining the fall before? Was it from a tillage pass or an anhydrous pass? Nanda inquired. Anhydrous was applied preplant, but not in that pattern. Plants were at V5 when Nanda noticed the pattern. He volunteered to help take tissue samples to see if there was a difference between off-color plants and regular-appearing plants. He collected 25 leaves each from the stunted and regular plants.
Betsy Bower, Ceres Solutions, based in west-central Indiana, was also interested in determining if the plants were different. She arranged for sampling at SureTech Lab in Indianapolis. Ceres Solutions covered the cost.
What results say
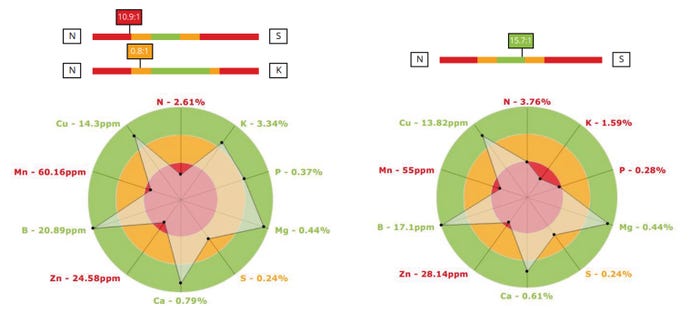
If you guessed everything was lower in the yellowish sample, it’s a good thing you guessed and didn’t bet! Potassium and phosphorus were considerably higher. Sulfur was the same.
However, zinc was lower, at 24.58 parts per million, in the yellow sample versus 28.14 ppm in the green sample. The lab still labeled both deficient.
“We like to see 30 parts per million for zinc at V5, and we get really concerned at 20 or less,” Bower says. “The big difference was in nitrogen, and in the nitrogen-to-sulfur ratio. Nitrogen was 2.61% in the yellow sample versus 3.76% in the green sample. That’s a big difference at that stage, and likely explained the color variation.”

The entire field received the same nitrogen rate plus zinc as starter. It’s not unusual to see relatively low zinc levels at V5, even if zinc was in the starter, Bower says. Corn is a high-responding crop to zinc, especially from emergence through V5.
If soil compaction caused the streaks, the roots of pale plants may have been slower to get started. Perhaps they were restricted in some way, Bower says. That might explain why those plants were lower in nitrogen early.
What is the rest of the story? The source of the streaks wasn’t pinned down. By V8, the difference in leaf color began to disappear, and the streaks were no longer obvious. No more tissue tests were pulled. The entire field averaged 230 bushels per acre of dry corn.
About the Author(s)
You May Also Like


