Subscribe to receive top agriculture news
Be informed daily with these free e-newsletters

Think DifferentAn Export Rollercoaster: Total U.S. corn sales2010/11 1.8 billion bushels2011/12 1.5 billion bushels2012/13 0.7 billion bushels2013/14 1.9 billion bushels
December 21, 2014
U.S. corn exports rebounded dramatically in 2012/13 from the previous market year, when sales hit levels not seen since 1970. The first six weeks of the current marketing year suggest further improvement.
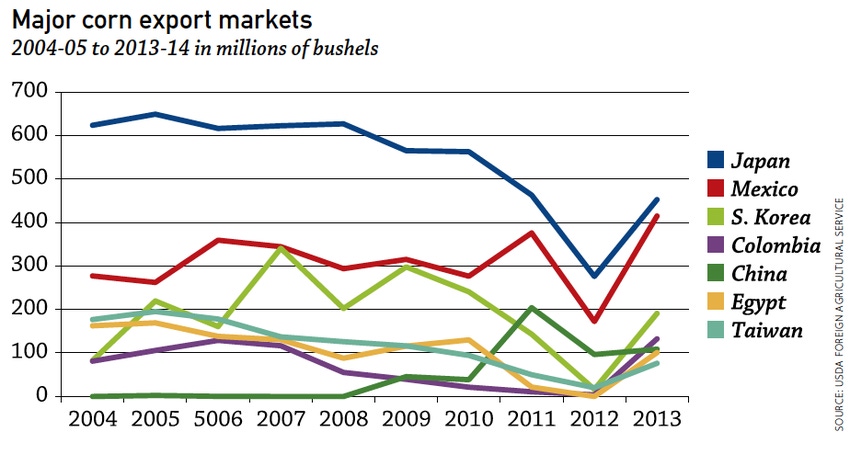
Economist Erick Erickson, vice president of the U.S. Grains Council, provides snapshots of the dynamics in seven countries representing 80% of U.S. export sales.
Japan’s U.S. purchases dived from 462.9 million bu. (mbu) in 2011/12 to 275.8 mbu then recovered to 452.6 mbu in 2013/14. U.S. sales more than doubled early this market year.
“They’ve been trending down slowly as a market for years, but remained our #1 market. Japan has a stable, aging population so their domestic feed industries are gradually declining as imports of finished products increase. In 2012/13, with U.S. supplies limited, they bought everywhere, especially South America. High prices in recent years stimulated world corn production, and our competitors really ramped up exports, so there was plenty of corn out there.”
Mexico more than doubled its purchases last year from 172 mbu to 414.7 mbu, only 38 mbu behind Japan. U.S. sales early this market year doubled again.
“Mexico’s imports have been building for years, and they came back strong last year to recover to their previous pattern. Almost all imports come from the U.S., and they take a lot of distillers dried grains, too.”
South Korea rocketed from 16.4 mbu in purchases to 190.9 mbu last year. Its buying was up sharply as of Oct. 16.
“South Koreans are the most creative importers. They will buy what’s cheapest – feed wheat and anything else, wherever they can find it. Over the past 20 years, we’ve seen the U.S. market share fluctuate between 3% and 90%.
“Underlying that, everything suggests they still have modest growth potential in their livestock sector.”
Colombia’s purchases increased from 3.7 mbu to 132.4 mbu last year. Sales this Oct. 16 were running 4.5 times higher than the same time last year.
“Now that we have the Free Trade Agreement, the U.S. is back in the game. Colombia’s imports are growing, and there’s continued growth potential. And we have a transportation advantage over Brazil and Argentina.”
China improved only slightly (12.2 mbu) from 2012 to 2013 (from 96.5 to 108.7 mbu), and its U.S. purchases were down 18.2 mbu early this year.
“According to reports, they’ve had record crops, so they have huge domestic supplies and huge government-owned stocks, and they are stimulating domestic production by maintaining corn prices above world levels.
“Biotechnology is an issue, but only one of many. China’s political leaders are debating how dependent they want to be on international trade or whether they really need it. There’s a strong sense that China’s rice bowl must remain firmly in Chinese hands.”
Egypt bought no U.S. corn in 2012/13, relying instead on imports from the Black Sea region. Last year, U.S. sales topped 100 mbu, and Egyptian purchasing is up this year.
“We started to see our exports erode before 2011 as inexpensive supplies from the Ukraine ate into our market share. We’re price competitive now, at least partly due to freight rates, but Ukraine is going to continue to have some price advantages in the eastern Mediterranean.”
Taiwan went from 20.2 mbu to 76.3 mbu last market year. Sales are up modestly this year.
“We’ve lost significant market share due to prices. They’ve been buying from South America, but there’s also a modestly declining trend in corn imports because they are importing more finished products.”
You May Also Like
Enter a zip code to see the weather conditions for a different location.


