
Subscribe to receive top agriculture news
Be informed daily with these free e-newsletters
November 1, 2011
Many Illinois farmers have been disappointed with 2011 corn-after-corn yields, reporting significantly lower corn-after-corn yields compared to corn-after-soybean yields. So as to provide guidance for 2012 planting decisions, breakeven corn-after-corn yields are calculated for farms in northern, central Illinois with high-productivity farmland (central-high), central Illinois with low-productivity farmland (central-low) and southern Illinois regions. Breakeven corn-after-corn yields are between 24 and 35 bu. lower than corn-after-soybean yields.
Breakeven Corn-After-Corn Yields
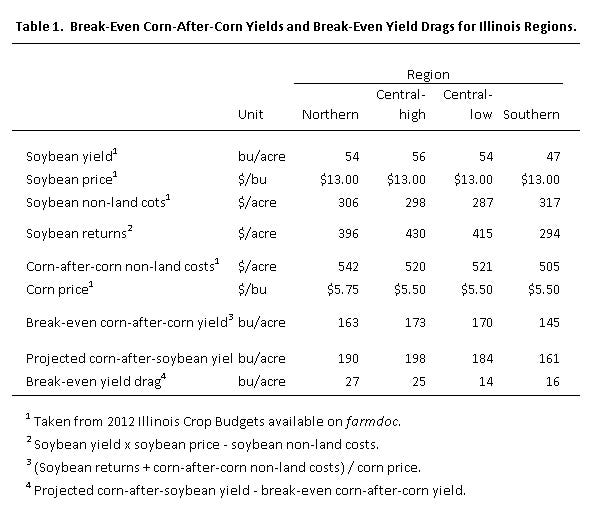
Breakeven corn-after-corn yields are calculated in Table 1 and require soybean returns, corn-after-corn non-land costs and corn price information. Calculations are shown for northern Illinois. In northern Illinois, soybean returns are projected at $342/acre (54-bu. soybean yield x $12 soybean price - $306 non-land costs). This soybean return, along with corn-after-corn non-land costs and corn price, are used to find the breakeven corn-after-corn yield. For $542/acre of non-land costs for corn and a $5.50 corn price, the breakeven corn-after-corn yield is 161 bu./acre (161 bu. = ($342 soybean return + $542 corn non-land costs) / $5.50 corn price). This means that corn-after-corn with 168-bu. yield will give the same return as soybeans with 54-bu. yield.
The 168-bu. breakeven corn-after-corn yields for northern Illinois is 29 bu. below the 190 bu. projected yield for corn-after-soybeans. This suggests that the breakeven yield drag between corn-after-soybeans and corn-after-corn is 29 bu. in northern Illinois. Calculations in other regions indicate:
The breakeven corn-after-corn yield in central-Illinois with high productivity farmland is 163 bu./acre, 35 bu. below the 198 projected corn-after-soybean yield.
The breakeven corn-after-corn yield in central Illinois for farms with low-productivity farmland is 160 bu., 24 bu. below the 184-bu. projected corn-after-soybean yield.
The breakeven corn-after-corn yield in southern Illinois is 143 bu./acre, 24 bu. below the 161-bu. projected yield for corn-after-soybeans.
Obviously these break-evens vary with differing prices, yields, and costs. Farms will have different yields and costs; hence, breakevens vary across farms.
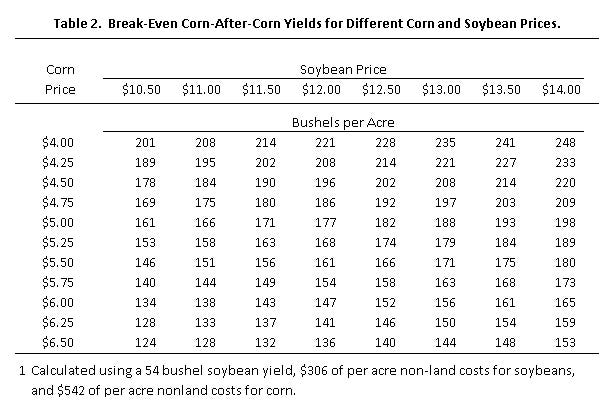
Projected corn and soybean prices impact breakeven corn-after-corn yields. Table 2 shows breakeven corn-after-corn yields for differing corn and soybean prices, given costs and yields typical of northern Illinois. Breakeven yields decrease as corn price increase. Breakeven yields decrease as soybean price decreases.
Historical Breakeven Corn-After-Corn Yields Relative to Soybean Yields
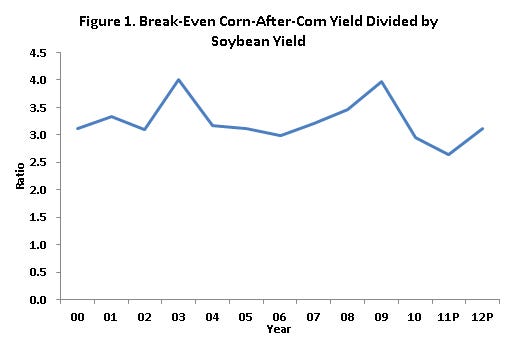
For northern Illinois, the 161-bu. breakeven corn-after-corn yield is 3 times the 54-bu./acre projected soybean yields. The 3 ratio is low compared to historical ratios. From 2000 to 2010, the corn-to-soybean break-even ratio has averaged 3.3 (see Figure 1), meaning the corn yields had to be 3.3 times higher than soybean yields to break even. This current relatively low ratio suggests that market signals are favoring corn production over soybean production.
Summary
Break-even corn-after-corn yields for 2012 are presented in this paper. These break-evens corn-after-corn yields are between 24 and 35 bushels lower than corn-after-soybean yields. The 2012 break-even corn yields relative to soybean yields are low from a historical perspective. While farmers are questioning whether to continue with as much corn-after-corn, market prices and costs suggest corn is relatively more profitable than soybeans from an historical perspective.
Tables courtesy University of Illinois.
You May Also Like
Enter a zip code to see the weather conditions for a different location.


