Last month, I introduced a particular type of market analysis, called similar years analysis. Similar years analysis is a look at price action in years that share similar fundamentals. My March column looked at the soybean market and years, like this year, when the Jul/Nov (old crop/new crop) spread was running a sizable inverse.
This type of analysis is intriguing enough to call for an encore, with a different fundamental factor and a different crop. What fundamental factor has my attention this month? Strong demand for corn is drawing down supplies and by the end of the crop year, corn stocks are projected to be the lowest in 7 years. What happened in similar years with tight corn stocks?
First a word on the best way to measure stocks. Should we simply look at total bushels? It makes more sense to look at stocks relative to usage. I’ll illustrate the difference with an example. In February, USDA projected corn ending stocks at 1.5 billion bushels, roughly the same as at the end of the 1994/95 crop year. The difference? Back then, total demand was less than 10 billion bushels. Today, total demand is edging towards 15 billion bushels. What was ample corn stocks in 1995 is just a little over 5 weeks of usage in 2021.
Since 1990, endings stocks of corn have averaged 7.2 weeks of usage, with a high of 12.5 weeks (1992/93) and a low of 2.1 weeks (1995/96). I selected tight stocks years, defined here as years when the February WASDE report was projecting ending stocks at 6 weeks of usage or less. Twelve years fit the definition and it is interesting to note that nine years sported tighter stocks than the 5.3 weeks projected in 2021 (BTW, you have to go back to the 1973-75 crop years to find more years with ending stocks less than 6 weeks.)
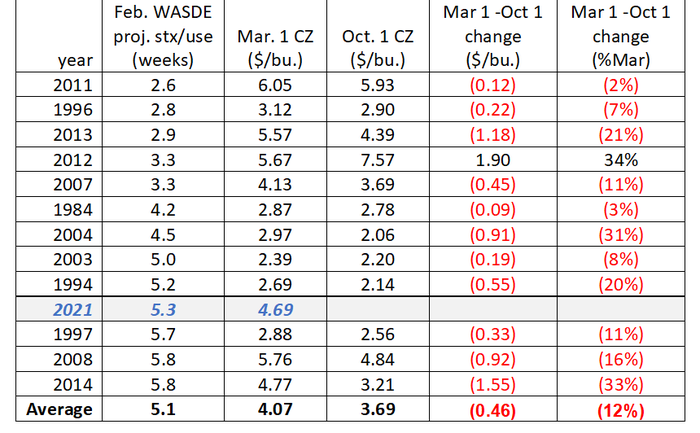
The following table focuses on these 12 years. Rather than list the years chronologically, I chose to list them starting with the tightest stocks projection. For example, the February WASDE report projected total corn usage in the 2010/11 crop year at 13.5 billion bushels. Do a little math and you find that 675 million bushels of projected ending stocks would cover just 2.6 weeks of corn usage. That’s not much of a cushion before the new crop is harvested.
December Corn Futures, 1990-2021
Years when projected corn stocks/use <6 weeks in the February WASDE

Data source: USDA WASDE reports and CME Group closing futures prices
What does this look at similar years reveal? Of these 12 years, December new crop futures traded lower in 11 years from early March to early October (92% of years). The exception is 2012, a drought year. If drought is in the cards for 2021, prices will trade higher. Looking at all 31 years from 1990-2020, new crop futures declined in 22 years, or 71%. How can we explain a greater tendency for lower prices in years when stocks are projected to be tight?
In many of these years, prices were already elevated early in the year, anticipating a narrow balance between supply and demand. Higher prices tend to encourage supplies (more planting) and dampen demand. I found it interesting that in 9 of 12 years, the final stocks situation at the end of the crop year was not as tight as projected in the February WASDE report. Markets adapt!
Should you start pricing new crop corn today? There is nothing special about early March – in some years it paid to be early, but just as many years it paid to wait until late spring or early summer. Try to get something done in the first half of the year. If you are convinced that this will be a drought year, use put options.
About the Author(s)
You May Also Like


