Marketing your crops takes a good view of the big picture. But judging the size of this year’s corn and soybean potential won’t be easy, especially for those who can’t see past their own end rows. Widely varying conditions from one end of the growing region to the other could cloud attempts to forecast average yields for the entire country.
USDA’s first survey of farmers Aug. 12 showed average U.S. yields below the 20-year statistical trend, or normal reading. The agency’s next update Sept. 12 will include field samples for the first time following weekly Crop Progress reports showing declining conditions nationwide.
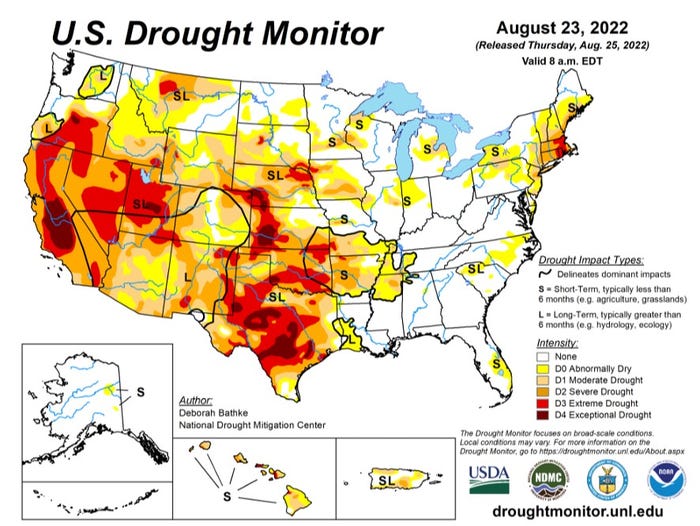
Maps from different sources illustrate what’s happening: Crop Progress ratings, USDA’s August estimates, the Drought Severity and Coverage Index and Drought Monitor, and the Cropland Vegetation Health Index. Here’s what the data shows.
From drought to flood
Dry conditions that first began to emerge in the Western U.S. three years ago eased slightly nationwide in August, but two-thirds of the country is still suffering, according to the weekly Drought Monitor.
Intensifying dryness plagues much of the northern and western Corn Belt, while potential appears to be improving in some other parts of the East and South. However, easing drought in some areas came at the hands of historic floods that damaged crops, with the National Weather Service admitting the full extent of the event couldn’t be measured due to communications outages at local offices.
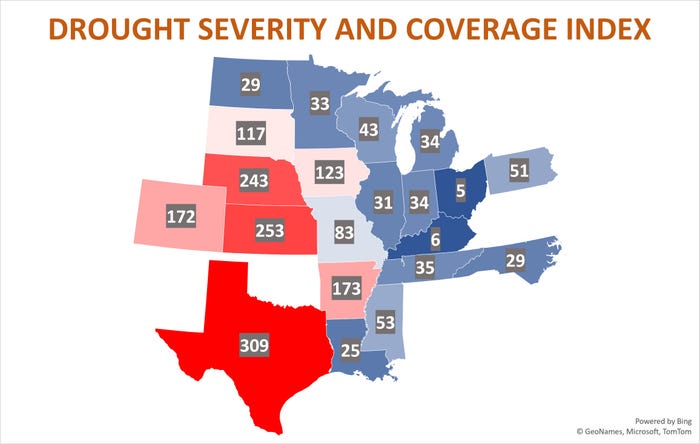
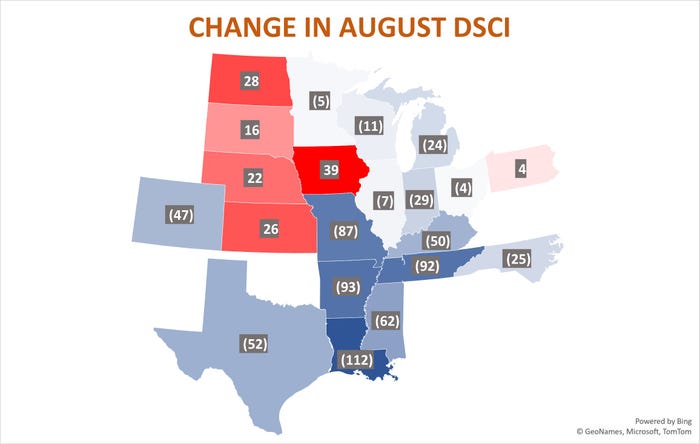
The latest Drought Severity and Coverage Index focused concerns west of the Mississippi River, though states in the Delta and upper Midwest mostly were wetter. Still, only six states experienced a worsening situation in August so far: Iowa, Pennsylvania, the Dakotas, Nebraska, and Kansas.
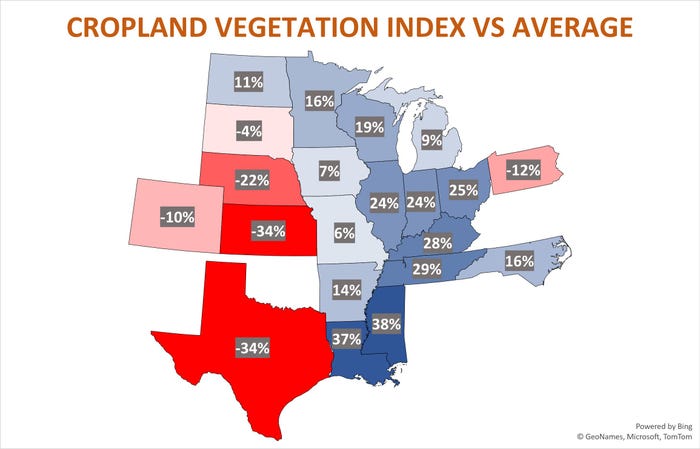
The DSCI mostly matched what was reported for the Cropland Vegetation Health Index. Comparison with average readings for late August put most of the problems on the Plains. However, recent disruptions to the satellites used to gather VHI make week-to-week changes difficult to assess.
Corn in the crosshairs
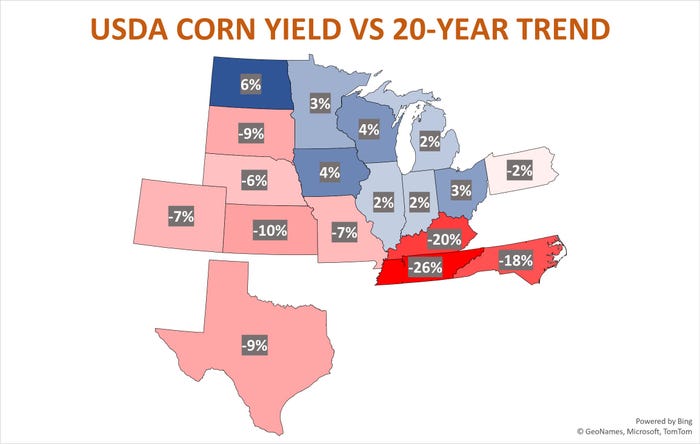
USDA’s Aug. 12 production survey put the U.S. corn yield at 175.4 bushels per acre, 1.5% below the trend yield of 178. Above-normal yields were found around the Midwest Great Lakes and Upper Midwest states. Below-trend yields were noted south of the Ohio River and in other states west of the Mississippi River.
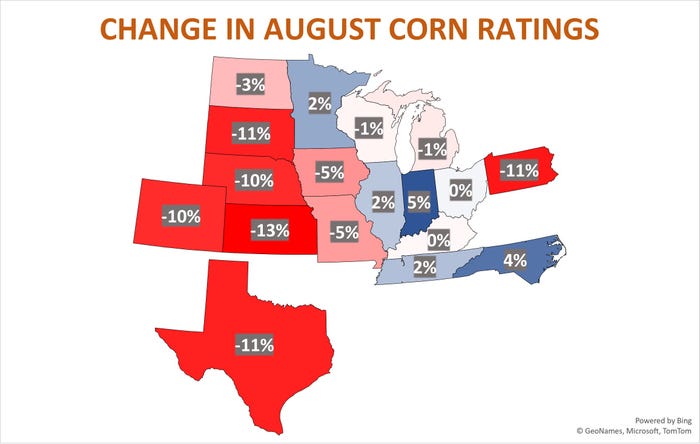
August ratings declined in all but five of the 18 states included in the weekly condition reports that accounted for 92% of last year’s acreage, with the U.S. average off 4%. Translating ratings into yield forecasts suggests the crop has last around three bushels per acre, with last week’s reading coming in at 172.2 bpa in a range from 170.7 to 174.1 bpa. Still, the percentage of corn acres affected by drought dropped 1% last week to 27%, the lowest in nearly two months.
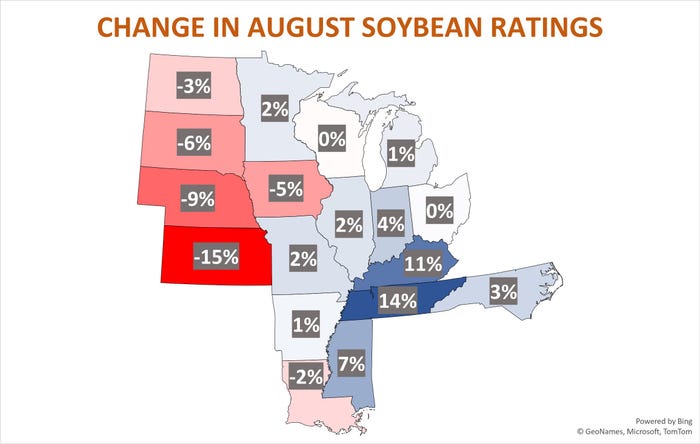
Soybean states show improvement
USDA Aug. 12 put the nationwide soybean yield at 51.9 bpa, above trade expectations and the agency’s “normal” yield for 2022 of 51.5 bpa. The 20-year statistical trend yield for beans is 52.2 bpa, but the government’s formula is adjusted by average growing season weather in August and July and June crop stress in seven key Midwest states.
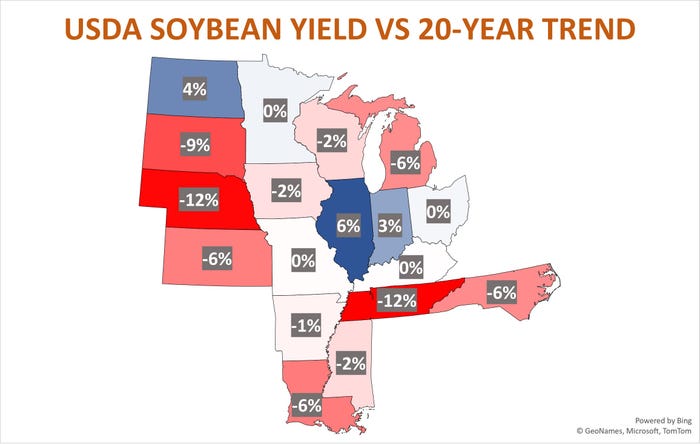
USDA’s August soybean yields were below the 20-year trend on most of the Plains and Southeast, along with Iowa, Wisconsin and Michigan. Since then conditions improved in only five of the 18 states that accounted for 96% of 2021 acres, though the percentage of the crop in drought dropped to 20%.
The improvement boosted yield projections based on ratings to 52.5 bpa, though a few models take yields below 50 bpa.
August temperatures in key states into the end of last week were virtually average while rainfall fell 8% short overall, cutting into the forecast by the weather model slightly. That method, based on a formula developed by USDA, put the yield at 51.8 bpa.
Nitrogen costs rising
The bottom line for yields headed into the Sept. 12 USDA report would appear to call for only modest changes to the agency’s August projections. The same wasn’t true for fertilizer prices last week, after more European plants slashed output to conserve natural gas supplies that already look much too tight headed into a winter of uncertainty due to the war in Ukraine.
Daily British natural gas futures jumped more than 40% last week with values on the continent up more than 30%, so production of nitrogen fertilizers is cost prohibitive anyway, forcing companies to import supplies from a global market that’s still tight despite a big drop from record spring prices.
That prospect sent U.S. values sharply higher as well, forcing some dealers to increase prices they just slashed for fall applications. That could add $75 a ton to ammonia prices, while September Gulf urea futures surged more than $100 to trade at $700. Gulf 32% UAN for September gained $50 to $490.
Diesel costs could also be headed higher, at least for growers whose dealers price off the Chicago terminal. A fire at a Whiting, IN refinery shut down production at the largest Midwest facility, causing cash prices to jump.
Crude oil markets also headed higher last week, with the nearby contract poking briefly back above $95 a barrel as traders wondered whether OPEC and its allies could cut production in the face of a potential restart of exports from Iran if a nuclear deal is reached with the West.
Another cost headed higher: money. Federal Reserve Chairman Jerome Powell Friday said the central bank was posed to keep raising interest rates to fight persistent inflation. Betting on Federal Funds futures indicated another three-quarters of 1% increase in September, with rates hitting 4% over the winter. Commercial loan rates are typically 3% above Fed Funds, and some analysts see 5% as the “terminal rate” that could eventually bring inflation under control.
Knorr writes from Chicago, Ill. Email him at [email protected]
The opinions of the author are not necessarily those of Farm Futures or Farm Progress.
About the Author(s)
You May Also Like


