 *This is the seventh article in our 2022 Southwest Economic Outlook series. Hear from Oklahoma State University and Texas A&M AgriLife Extension economists about the 2022 outlook.
For many feed grain producers, 2021 was a profitable year. The national average corn yield was an all-time record high 177 bushels per acre. This is despite season-long drought conditions over much of the northwestern Corn Belt. The national average sorghum yield of 72.3 bushels per acre was above the ten-year average and the trendline projection. Prices were the highest since 2012 and 2013. Cash corn prices in the Texas Panhandle hit $8.00 per bushel in May. Sorghum traded at over a dollar per bushel premium to corn for much of late winter/early spring. Input costs for the 2021 crop year were up only marginally compared to 2020. The U.S. stocks-to-use ratio for corn to end the 2020/21 marketing year was a 30.4-day supply. This was the tightest since the 27.1-day supply to end 2012/13. The current estimate for the end of 2021/22 is up, but still a relatively tight 36.7 days.

How do the fundamental factors of supply and demand for feed grains look heading into 2022? What is the likelihood of an increase in ending stocks that put downward pressure or prices or vice versa?
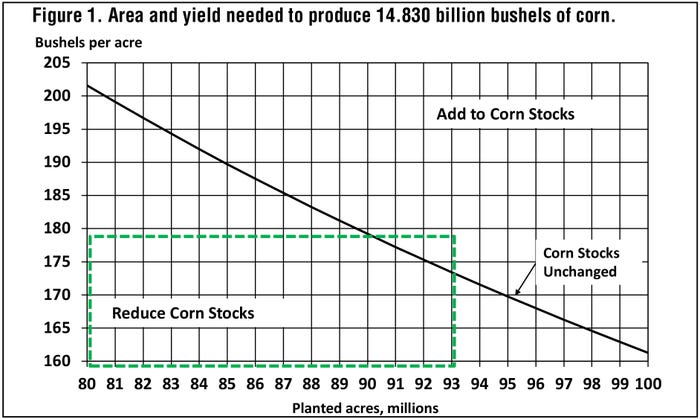
Use. U.S. corn use over the last six years has ranged from a low of 14.0 billion bushels (2019/20) to a high of 14.8 billion bushels (2017/18, 2020/21, 2021/22). The long-range projections from USDA for 2022/23 call for a 100-million-bushel increase in domestic use and a 100-million-bushel decrease in exports. That leaves total use unchanged at 14.8 billion bushels.
Supply. One of the greatest areas of uncertainty for 2022 is the impact of record-high fertilizer prices. How will this impact farm productivity, profitability, and planting decisions? Will farmers opt for crops that are less fertilizer intensive given these high input costs? While nominal fertilizer prices are twice what they were a year ago, by another measure, the price increase has been more moderate. For example, in 2014 anhydrous ammonia was $851 per ton. With the seasonal average corn price of $3.70, it took 230 bushels of corn to pay for one ton of anhydrous. At current estimates ($1,014/ton anhydrous and $5.40/bushel corn), the price of anhydrous is 187 bushels per ton. Profits from corn production are still likely at these price levels. How these prices change between now and planting may offer insight into the impact on planted area.
 Ending Stocks and Price. If farmers plant about the same number of corn acres in 2022 as 2021 (about 93 million) and we once again achieve a trendline yield (about 179 bushels per acre), total production would exceed the 14.8 billion bushels of projected use. That would increase ending stocks again in 2022 and put downward pressure on prices.
Risk Management. A primary area of financial risk in 2022 is that producers will have locked in high input costs early season only to see prices fall significantly by harvest. This highlights the importance of a two-prong approach to risk management. First, cost management and input use efficiency while maintaining productivity, to get the breakeven cost as low as possible. Second, have as firm an estimate as possible on what that break-even cost is, then have a plan and tools in place to not let profitable price opportunities get away.
Missed an article in this series? Click the following links:
About the Author(s)
You May Also Like


