March 15, 2017

By Gary Schnitkey, University of Illinois
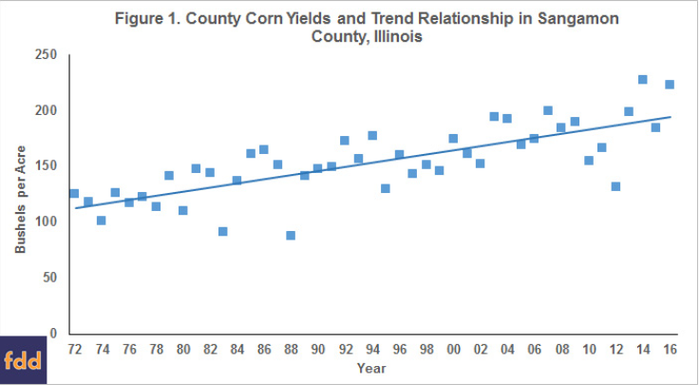
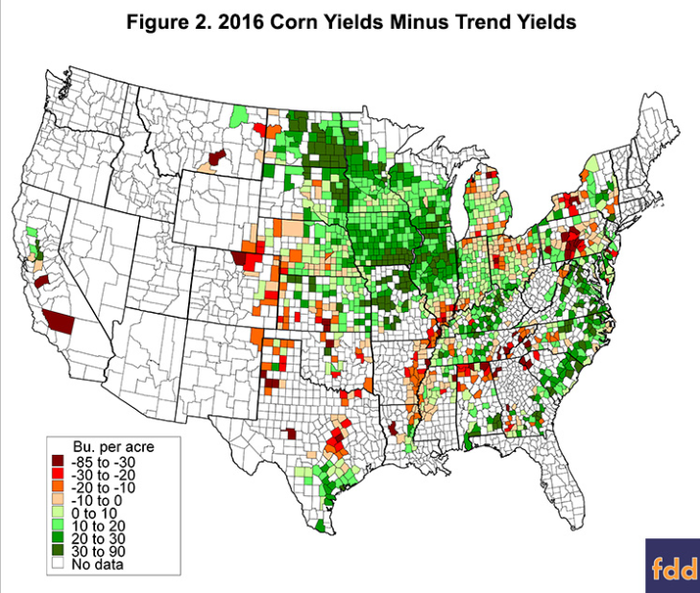
2016 Corn and Soybean Yields in Perspective | farmdocdaily.illinois.edu The National Agricultural Statistical Service (NASS) recently released 2016 county yields for both corn and soybeans. In this article, maps are produced showing actual 2016 yields minus 2016 trend yields. Examination of these maps shows areas of above trend and below trend yields for 2016. Areas of above trend yields will have higher 2016 incomes relative to those areas with below trend yields.Trend Yield CalculationTrend yields are calculated using data from 1972 through 2016. A linear line was fit through these yields using ordinary least squares. The 2016 trend yields were based on these linearly fit relationships.Figure 1 illustrates the process of arriving at a linear trend for county corn yields in Sangamon County, Illinois. The dots on the graph represent actual county yields. For the past five years, actual yields were 131 bushels per acre in 2012, 198 in 2013, 228 in 2014, 184 in 2015, and 222 in 2016. As can be seen in Figure 1, yields varied considerably from year to year. 
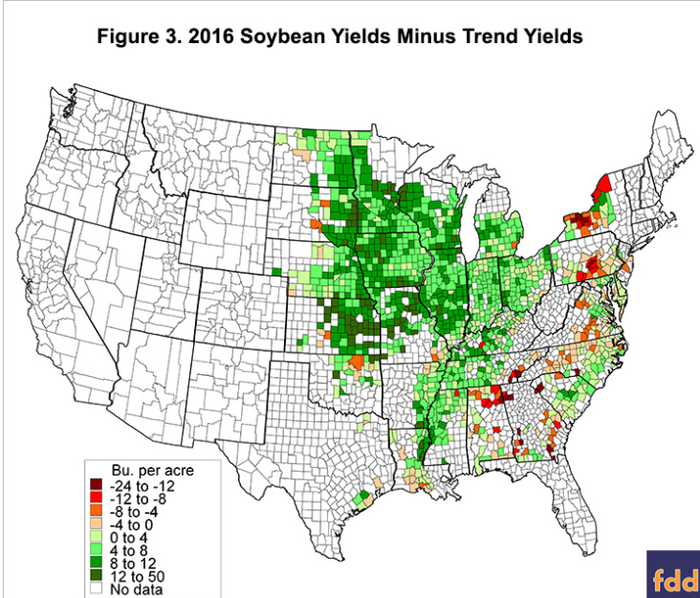
 2016 Corn and Soybean Yields in Perspective | farmdocdaily.illinois.edu Besides Indiana and Ohio, below trend yields predominated in Michigan, New York and Pennsylvania, a series of counties in the south from western North Carolina to Alabama, parts of the great Plains and Texas, and a string of counties along the Mississippi River. The Mississippi River counties begin in southern Indiana and Illinois, proceeding through southeast Missouri, Arkansas, Louisiana, and Mississippi.2016 Soybean Yields Relative to TrendExceptional yields for soybeans predominated over much of the nation (see Figure 3). Much of the corn belt and Mississippi River basin had above trend yields. Below trend yields occurred in New York, Pennsylvania, western North and South Carolina, and some counties in Georgia, Tennessee, and Alabama.
  2016 Corn and Soybean Yields in Perspective | farmdocdaily.illinois.edu Above trend yields across the nation should be expected as national yields were above expectations. In recent years, soybean yields have been exceptional (farmdoc daily, October 25, 2016)Impacts on 2016 Net IncomeThose areas with above trend yields will have relatively higher incomes than those areas that had below trend yields. In 2016, lower grain farm incomes will be more pronounced in the eastern corn belt and particularly in Indiana and Ohio.On the other hand, above trend yields had a positive impact on net incomes of farms in Illinois and the western corn belt. As an example, take the 2016 corn yields in Sangamon County described above. The midpoint of the corn range projected by WASDE is $3.40 per bushel. Multiplying $3.40 by the 2016 actual corn yield of 222 bushels per acre gives $755 of crop revenue per acre. This $755 of crop revenue is 95 per acre higher than the $660 per acre revenue had a trend yield occurred ($660 = $3.40 price times 194 trend yield). Clearly, above average yields had a positive impact on incomes in Sangamon County.In 2016, Sangamon County corn revenue will average $755 per acre given a 222 bushels per acre yield. To have $755 per acre at the trend yield would require a price of $3.90 per bushel ($755 revenue / 194 trend yield). In 2016, revenues in Sangamon County are roughly equivalent to having a trend yield and a corn price near $4.00 per bushel.SummaryMuch of the northern and central Illinois and the western corn belt had above average yields. Many counties in southern Illinois, Indiana, and Ohio had below trend yields for corn. These differences in yields have impacts on grain farm incomes. Above trend yields result in higher incomes in the western corn belt and below trend yields result in lower incomes in the eastern corn belt.ReferencesSchnitkey, G. "Soybean Yields in Illinois." farmdoc daily (6):201, Department of Agricultural and Consumer Economics, University of Illinois at Urbana-Champaign, October 25, 2016.U.S. Department of Agriculture, Office of the Chief Economist. World Agricultural Supply and Demand Estimates. March 9, 2017. http://usda.mannlib.cornell.edu/usda/waob/wasde/2010s/2017/wasde-03-09-2017.pdf Originally posted by the University of Illinois.
 You May Also Like


