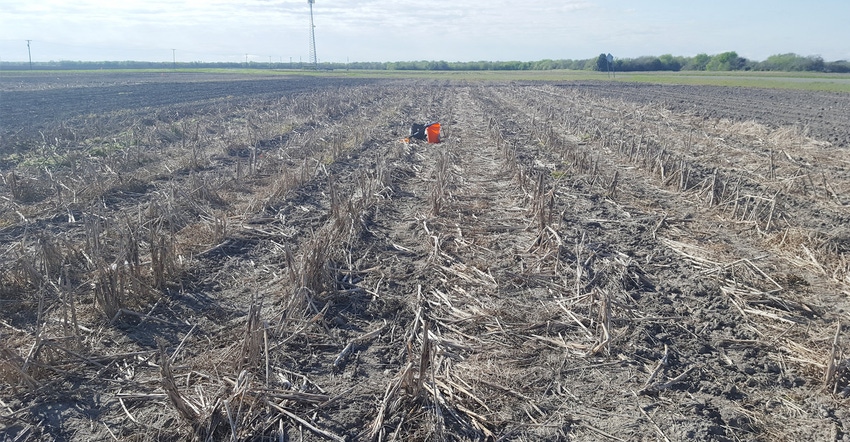
Soil health is a hot topic in agriculture. But what are the most useful and cost-effective indicators when it comes to determining a soil's health?
Project Scientist Kelsey Greub, Soil Health Institute, discussed several soil health indicators she and her team have identified through their project, "North American Project to Evaluate Soil Health Measurements." Greub spoke to an online audience at the recent Texas Plant Protection Association virtual conference.
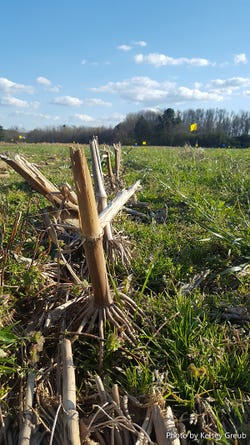 (Photo by Kelsey Greub, Soil Health Institute)
Greub compared soil health indicators to human health indicators. "When you go to the doctor, the nurse or technician take a few indicators. Those are usually things like temperature, weight, or blood pressure. These are essential health indicators that scientists and doctors have narrowed down as being essential, or vital," Greub says. "If you have a high temperature, it might tell you you have an infection. The same thing can go for soil health indicators."
But which indicators best tell a soil's health story? Greub's team narrowed down a long list, selecting only those indicators considered most essential and cost-effective, she says.
To develop the list, the team evaluated 124 long-term sites across Canada, Mexico and the U.S. Most sites have had consistent treatments for at least 10 years.
As they evaluated indicators, they asked three questions:
How do the indicators change with the soil and the climate? "That's why we chose to do the study across North America. We wanted a wide range of soils and climates."
Are the indicators sensitive to changes in soil management practices? "If we go from a moldboard plow to a no-till system, we want to see which indicators are reflecting that change over time because that's a good way for farmers and consultants to gauge how their soil health is improving or not improving."
Are the indicators affordable? "We don't want to break the bank," she says, adding that some soil health tests are expensive.
The team selected more than 30 indicators (a complete list can be found on their website). The indicators listed in Figure 1 are "the more widely used or accepted" indicators, she says. The list is divided into chemical indicators, such as pH; physical, such as soil texture, and biological indicators, such as enzymes.
Figure 1
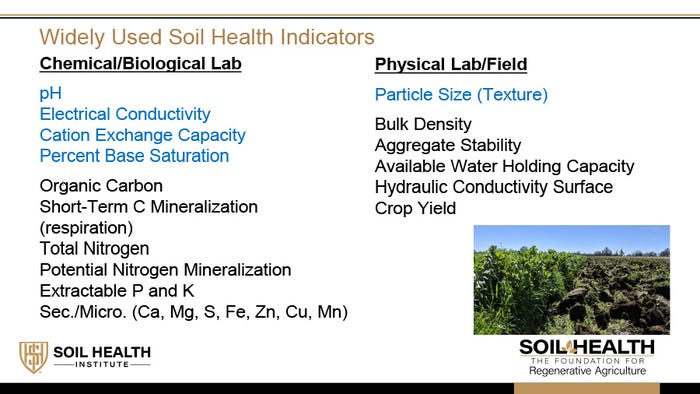
"We have all 12 of the soil texture classes represented," Greub says of the study. "We also looked at bulk density and aggregate stability, water cycling indicators, including available water holding capacity and hydraulic conductivity, which we measured in the field using a dual-head infiltrometer. And then we collected crop yield data from scientists, which we're still analyzing."
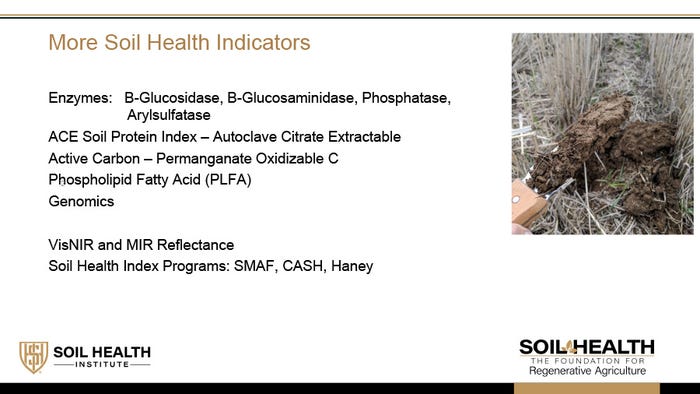
The indicators listed in (Figure 2), are not as widely accepted in terms of their overall effectiveness, Greub says. "A lot of these are biological soil health indicators. They are gaining a lot of attention, but there's still more work that needs to be done to evaluate these."
Figure 2
The team also analyzed the type of treatments used, such as tillage, crop rotations, applied organic amendments and grazing and rangeland treatments.
Indicators
Greub discussed a handful of target indicators and their response to change in management. For example, carbon indicators and how organic carbon is increased through management practices such as residue retention, organic amendments (litter or manure, something added to the soil), cover crops, and decreased tillage (tillage intensity).
"We see some variability, but one of the biggest things we see is if we retain residue on the soil, instead of removing it, we're improving soil carbon," Greub says.
Applying organic amendments, which contain high levels of carbon, also increases soil carbon. "You're adding more carbon to the system to be cycled," she adds.
Decreased tillage and cover crops also increase soil organic carbon. "We see about a 10% increase in soil organic carbon when we use cover crops versus not," Greub says. "So, a lot of these carbon indicators are telling us similar things."
Nitrogen
For most nitrogen indicators, decreased tillage intensity increased nitrogen, Greub says. "Some of these indicators are sensitive to that change but some are not."
When litter or manure is added, the total nitrogen increased by 20% and nearly 20% in ACE (autoclaved citrate extractable) proteins.
"We didn't see a lot of difference in crop rotations. When we looked at covers crops, we did see our nitrogen indicators respond, some being biological nitrogen indicators."
Biologicals
When it comes to biologicals, Greub admits she's not a soil microbiologist, but she referenced results the Soil Health Institute microbial biologists had collected (Figure 3).
Figure 3
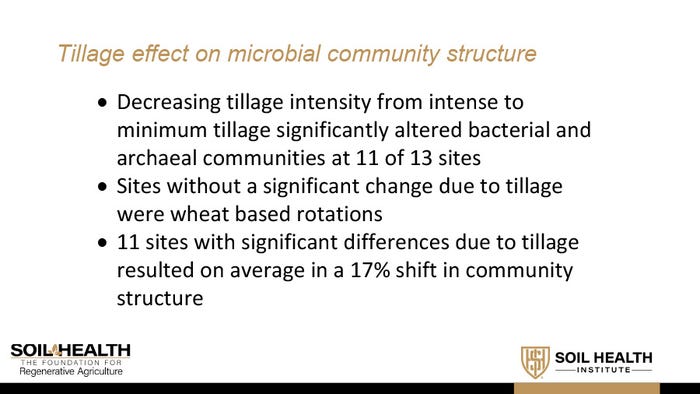
"Looking at intense tillage versus minimum tillage -- intense tillage being something disruptive to the soil and minimum tillage which is no-till systems or disturbance only at planting or fertilization -- what we see is when we decrease tillage, we're actually increasing some of the bacterial genes."
Why is that important? Enrichment of nitrogen cycling bacteria, she says. "Those are important, especially when we've got legumes. We want to get that nitrogen from the atmosphere into the soil for those plants to use."
Plants can't convert nitrogen by themselves, she says. "So, they need these microorganisms to convert that nitrogen. These are essential to overall soil health and plant health and soil productivity."
Physical indicators
The team also observed water cycling indicators, including available water-holding capacity, which is the amount of water available to the plant at that time. Greub referenced a site where half the field has been under no-till production and the other half intensively tilled.
"When we reduced our tillage, we increased our available water-holding capacity by on average 7%, which translates to about .15 inches per acre in the top 3 inches of the soil. That also gives us about 2,200 gallons per acre of water in the top 3 inches of soil. That's instrumental in crop resiliency in our dryland systems.
"When we decrease our tillage, decrease soil disturbance, we're holding in a lot more water and letting the organic matter sit, not letting it decompose as quickly," she says. "Organic matter helps that available water-holding capacity."
Using cover crops also increased the available water-holding capacity. "So, if we disturb the soil less, keep it covered, keep the right roots on there, we're adding some carbon to the soil and increasing our available water-holding capacity," Greub adds.
Aggregate stability
Another soil health indicator is aggregate stability -- the soil's resilience as the soil structures withstand water and wind forces. Aggregate stability is important for controlling erosion and runoff and overall plant growth, she says.
To measure how aggregate stability responds to different management practices, Greub used the Cornell Rainfall Simulator, Wet Sieve Procedure, SLAKES and Wet Soil Stability Index (Figure 4).
Figure 4
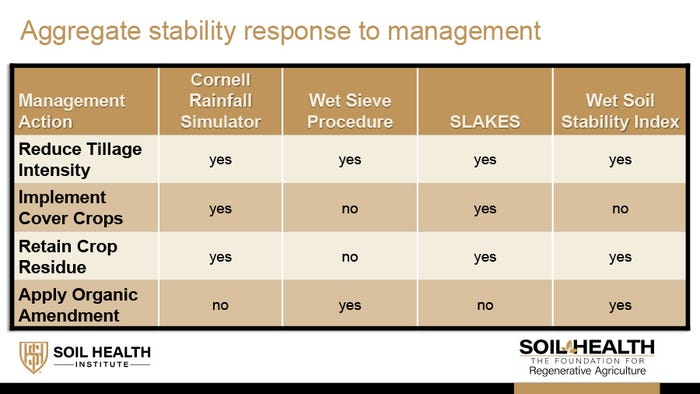
"When we reduce tillage, we increase aggregate stability. When you're not disturbing the soil as much, not breaking up those aggregates, you're improving stability."
Cover crops also increased aggregate stability, but only for two methods, she says. "Then we looked at retaining crop residue. We saw one of the biggest jumps in aggregate stability, but only for three of the methods."
Preliminary conclusions
Preliminary conclusions about some of the more effective or useful indicators include carbon, nitrogen and water cycling. "We want to consider cost and the response to management," Greub says. "For carbon, we're looking at the 24-hour respiration and active carbon indicators. For nitrogen, we're looking at total nitrogen. For water cycling indicators, we think available water holding capacity is very useful. And for aggregate stability, the Cornell and SLAKES method are both great indicators."
For more information visit, https://soilhealthinstitute.org/.
Read more about:
Soil Health IndicatorsAbout the Author(s)
You May Also Like


