It’s no exaggeration to say the stakes are huge for USDA’s big end-of-March data dump this upcoming Thursday.
The market is squarely focused on the agency’s first survey of spring planting intentions as farmers juggle profitable prices with uncertainty over fertilizer costs and supplies, not to mention world events.
Adding insult to injury: The latest settlement price for Gulf ammonia contracts surged to $1,475 a short ton, easily an all-time high.
The other report out March 31, detailing March 1 grain stocks, hasn’t garnered much discussion for corn and soybeans. But the supply of leftover old crop inventories at the end of the marketing year Aug. 31 could eventually become the ticking time bomb that ignites summer rallies or blows them up, because nobody knows how the coming months will play out.
Mid-year snapshot
Thursday’s tally provides a snapshot of how stocks shape up halfway through the crop year. Most of the factors that go into this equation are already pretty well known. March 1 stocks represent total available supplies less usage from September through February. Supply estimates won’t change much: 2021 crop production usually isn’t updated until the end of September, if then, and stocks at the beginning of the marketing year – 2020 crop ending stocks – are also fixed. Imports for the second quarter of the marketing year are known for December and January, and likely will be similar for February.
Data for most demand categories for both crops, including crushing and exports, are also established by other government and private sector reports.
The big unknown is a murkier one to estimate. The amount of corn fed to livestock is the “disappearance” assumed by subtracting exports and corn used for food, seed, and industrial uses such as ethanol from the total supplies. Feeding is a big number – the category comprises on average 38% of total corn demand, and the government’s guess for the 2021 crop is complicated by expectations little wheat will work into rations this summer.
Corn feed demand always includes some so-called residual usage, a catch-all used by government accounting to correct for sampling and other errors in its estimates.
USDA doesn’t break out residual usage for corn, but the category is a separate silo for soybean demand. Together with soybeans used for seed, this accounts for only 3% of total demand. While seed usage is fairly predictable, residual soybean demand can vary widely and is usually negative for several quarters each year as USDA adjusts for previous statistical error. Traders will keep an eye on the category nonetheless because it can be a tip off that the annual production estimate put out in January may be changed significantly the following September. Larger than expected March 1 stocks can be a clue 2021 production was greater than reported, or less if stocks come in below estimates.
Still, with so much uncertainty over acreage, the stocks data for the first half of the marketing year may not attract much attention. I put March 1 corn stocks at 7.897 billion bushels, up 2.6% from a year ago. When viewed as a percentage of estimated demand for the entire marketing year, first half usage is running on par with average levels. If the pace of usage is stronger than normal in coming months it would put even more pressure on yields and acreage to keep Aug. 31 inventories from falling below 1 billion bushels. USDA’s current estimate is 1.44 billion.
March 1 soybean stocks could come in at 1.928 billion, 23.5% more than in 2021. The increase is in part because usage in the first half of the marketing year appears around 6% slower than normal. But stronger demand in coming months could shift that dynamic, perhaps cutting USDA’s current year-end stocks estimate of 285 million by 100 million bushels or more.
How these numbers change in coming weeks could rattle the cages of both bulls and bears. Here’s a look at how demand categories are shaping up heading into the growing season.

Switch to ethanol?
Pain at the pump is expected to force drivers to cut back on gasoline fill ups. While the U.S. Energy Information Administration still sees consumption rising in 2022 and 2023, its estimates fell earlier this month in response to chaos caused by Russia’s invasion of Ukraine. As a result the agency also reduced its forecast for the amount of ethanol needed for blending.
That could lead to an about-face from USDA when it updates supply and demand forecasts in April. USDA raised its forecast for 2021-2022 marketing year corn consumption for ethanol production by 25 million bushels in March. But the energy agency puts the amount of ethanol needed for around the equivalent of 60 million bushels less.
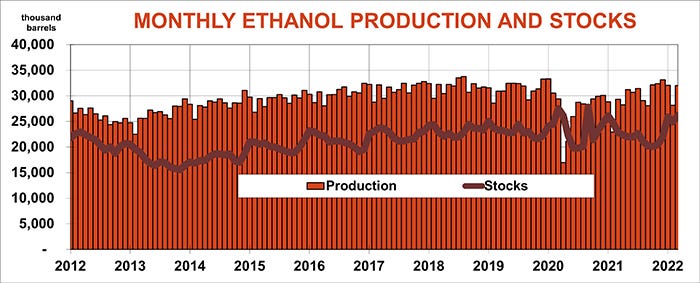
Ethanol’s fate could change if stations can blend the biofuel at higher rates, which appears justified by economics. Ethanol is trading at nearly a 40% discount to gasoline in the cash wholesale market, more than enough to overcome any energy advantage for petroleum.
Current ethanol production increases also are higher than forecast. Year-to-date production is up around 10% compared to the previous year. Those gains were inflated by still-weak output in the first half of the 2020 marketing year, so increases in coming months should slow. But even if production flattens, the total amount of corn used could be 25 million bushels or more greater than USDA last forecast.
Plant operating margins are back to break-even after surging late last year, when ethanol topped $3 a gallon and cash corn traded with a $5 handle. Production is regularly above 1 million barrels a day, so there’s be no slowdown yet on the ground.

Biodiesel boom
While the EIA trimmed its forecast for ethanol growth, the latest outlook raised estimates for biodiesel production as the world looks for “green” alternatives to fossil fuels, especially from Russia. U.S. soybean processors also stand to benefit from export restrictions imposed by Argentina after drought cut production there. The South American country is the world’s largest soy product exporter usually.
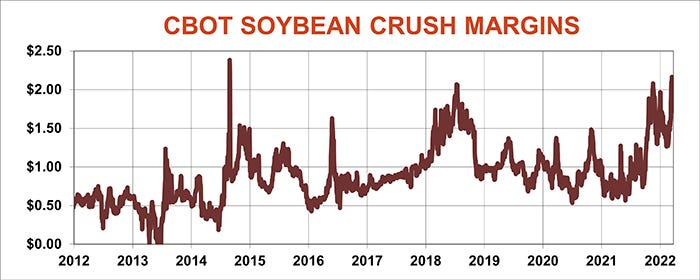
Soybean oil futures are consolidating below all-time highs achieved earlier this month, helping support crush margins at very attractive levels. Soybean meal has also rallied off last fall’s harvest lows, taking aim at $500 a ton.
Those factors could convince processors to boost output in the second half of the marketing year, a push that will be needed to achieve USDA’s forecast for a 3.5% increase overall. Crush in the first half of the marketing year is up just half of 1% so far.

Corn growers to the rescue
USDA’s current forecast assumes near-record U.S. corn production in 2021 will boost ending stocks from the previous year. But rising exports may cut into the surplus because we may be the only store in town for many buyers, depending on how the cards fall in coming months.
Argentine production is already affected by drought, and Brazil’s big second crop also faces hurdles though conditions appear to be improving. The big question, of course, is how much if any corn Ukraine will be able to move through its besieged Black Sea ports, with plantings there expected to fall by half, further restricting supplies for 2022-2023.
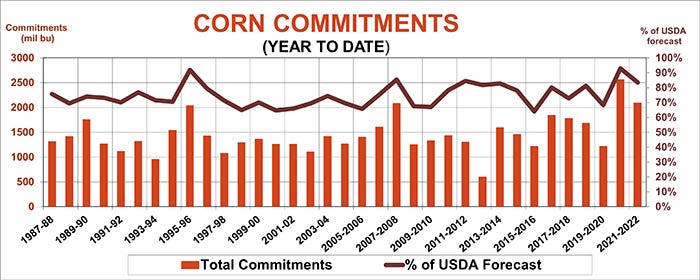
Total sales and shipments to date are on track to meet USDA’s export forecast for 2.5 billion bushels, with shipments running a little slower. Net sales over the past month were erratic, but managed to average above 50 million bushels a week and shipments also picked up, increasing potential for exports to be better than expected. Momentum could build if more countries reduce their own sales to hoard supplies in the face of so much uncertainty. So far, however, end users don’t appear to be panicking – yet.

China’s soybean diet
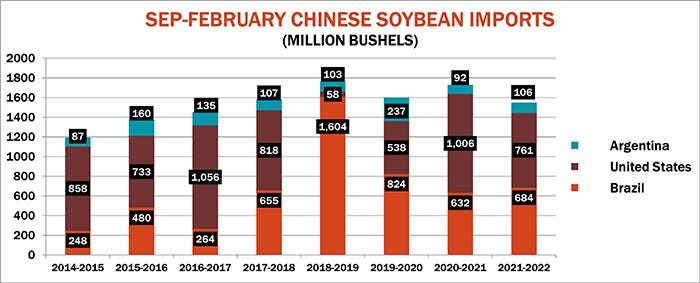
After years of steady – and at times explosive – growth, China’s appetite for soybeans is on a crash diet. Government pressure to reduce both usage and imports is working, maybe too well. Total imports for the first half of the marketing year ran 11% behind 2020-2021 levels, almost twice the decline forecast by USDA. Delays to the start of the shipping season out of Brazil could be one explanation for the difference. But movement out of the U.S. to China in February was still 44% lower than the previous year and total commitments from the U.S. are off 23% year-to-date.
Depending on how final production in South America turns out, the U.S. could be poised to pick up additional business, perhaps boosting sales 50 to as much as 135 million bushels – if exporters can overcome the slow start by China. Politics, as China triangulates its position with the U.S. and Russia, could spell the difference, one way or another.
Knorr writes from Chicago, Ill. Email him at [email protected].
The opinions of the author are not necessarily those of Farm Futures or Farm Progress.
About the Author(s)
You May Also Like


