May 10, 2022

The markets are reacting to a plethora of factors today. This is nothing new. Lately, every bit of news in the world creates a buzz and what appears to be a trading frenzy.
Planting in the U.S. is off to a slow start. It is the slowest in almost 20 years by some measurements. Drought is taking its toll on the world and the U.S is not immune. But we are also wet, and the delayed planting may reduce yields as well. Ukraine is not planting as they normally would, and world stocks will be affected. We all know this. Guess what? The market does too!
I am only a betting person when there is no money on the line, and I know my guestimation won't cost me anything but a quick retraction in words. With that said, I told someone yesterday that when planting progress was released in the afternoon it would show that we are behind, but the hot and dry weather approaching would curb any excitement in the markets.
Depending on when you look at the prices on the board of trade today, I may prove right but I may be flat wrong. But I am also not waiting for a rally or a sell signal to sell grain. I have no skin in the game apart from concern for our customers and their ability to make great sales and hedge appropriately. And maybe it is my conservative nature, but I can’t understand why anyone would gamble on a weather forecast or a drought or a war or a picture on their favorite media outlet as a business strategy. I think I need an antacid just thinking about it.
Did you know there is a USDA report coming out on Thursday? There is another one I struggle with. Are we counting on the USDA to give us the price we need to finally sell or hedge? Marketing can’t work like this- not consistently. Your stomach lining, heart rate, and the soles of your shoes will wear out from the stress and pacing. Have you looked at the prices on the Board of Trade? Do you see the dramatic inverse from July to September? Do you see the prices for 2023 crops and 2024?
If you can’t lock those in with sales, I get it. But you really should hedge against what we know normally follows rallies like these; “High Prices Will Cure High Prices.” We will get back to producing record crops, and because you are really good at it, prices will drop as a result.
Speaking of the USDA report, it is coming up on Thursday. It is not meant to hinder you from making decisions, but to be informative –and it tends to affect price.
Thursday's WASDE report
Brian Basting of our research department put together the following information on the report.
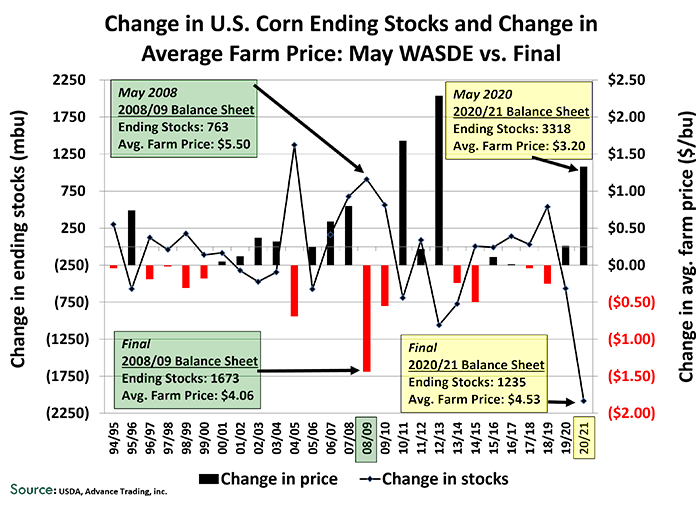
The May 12 USDA Supply/Demand report will provide initial forecasts for new-crop corn (2022/23). It utilizes data from the Prospective Plantings report and trend yield to generate crop size. Usage is based on world supply and demand prospects. The chart below looks at the history of changes from the May preliminary forecasts to the final results. Specifically, it shows the change in final ending stocks and average price vs. initial projections. The left axis shows the change in final ending stocks vs. May of the preceding year (line). The right axis shows the change in the final average farm price vs. the midpoint of the range in the May report (bar); e.g. final ending stocks for 2018/19 were 539 mbu above the May forecast, and the average farm price was $0.25 lower.

It’s important to note that significant adjustments to ending stocks and average farm price vs. the May forecasts are possible. For example, the USDA two years ago pegged ending stocks of U.S. corn for the 2020/21 crop year at 3.318 billion bushels. The average farm price estimate was $3.20. Although aggregate corn usage for 2020/21 was actually 21 million bushels lower than in May of 2020, total supply was down nearly 2.1 bbu due to sharply lower acreage and reduced yield.
As a result, projected ending stocks of 1.235 bbu for 2020/21 were down 2.083 bbu from the previous year and the average farm price was $1.33 higher. Alternatively, significant downward adjustments to demand have also been seen. In 2008/09, final usage was 704 mbu lower vs. May of the previous year due to weaker levels of food/seed/industrial (-367), exports (-242) and feed/residual (-95). Final ending stocks that year were 910 mbu higher, and the average farm price fell $1.44 relative to the May forecast.
Uncertainty regarding supply and demand factors creates market volatility, and eventual adjustments to fundamentals can result in a much different market than originally envisioned in May at planting time.
Be prepared
At Advance Trading, we want you to cheer for high prices and be prepared for falling ones. We want you to utilize the market and capture every opportunity it gives. Fundamentals will change, and your plan for marketing should offer downside protection and a plan for capturing a rally. Don’t get caught in the market inverse or in the noise of the next headline. And as Biran always says, “Your Advance Trading advisor stands ready to assist in that process.”
Happy planting!
Information provided may include opinions of the author and is subject to the following disclosures:
The risk of trading futures and options can be substantial. All information, publications, and material used and distributed by Advance Trading Inc. shall be construed as a solicitation. ATI does not maintain an independent research department as defined in CFTC Regulation 1.71. Information obtained from third-party sources is believed to be reliable, but its accuracy is not guaranteed by Advance Trading Inc. Past performance is not necessarily indicative of future results.
The opinions of the author are not necessarily those of Farm Futures or Farm Progress.
You May Also Like


