One of the technical indicators of significant value is a “gap” on the daily price chart of vertical bars showing the high and low price range traded for each day.
A gap is created on the daily price chart when:
The highest price of one trading day is lower than the lowest price for the next trading day, or
The lowest price of one trading day is higher than the highest price of the next trading day.
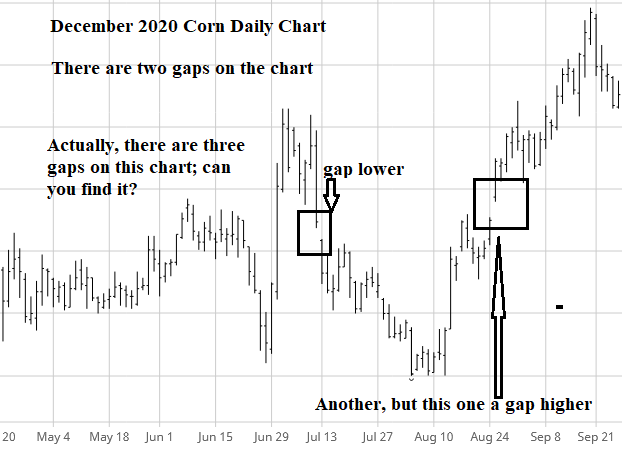
On Friday, July 10, 2020, December 2020 corn traded a low of $3.43¾. On Monday, July 13, 2020, that contract traded a high of only $3.42 as the market “gapped lower.”
Note the low on the July 10 was 1¾ cents higher than the high the next business day, July 13.
That left a gap on the chart. Later in August, December corn “gapped higher.” Take a look at the chart below with boxes around the two gaps:

The technical significance of a gap is that:
If the market is trading below the gap, the gap is an area of resistance, meaning the closer the price comes to the gap, progressively more sell orders will be encountered, “resisting” the uptrend of the price. The safest sell order is at a price at the top of the gap, which is not likely to be filled the first time the price moves into the gap area.
If the market is trading above a gap, the gap is an area of support, meaning as the price declines toward the gap, progressively more “buy” orders will be encountered, providing “support” for the price. The safest buy order is at a price at the bottom of the gap, which is not likely to be filled the first time the price moves into the gap.
Many technicians think a gap acts like a magnet, pulling the market toward it and, until the gap is filled 100%, that magnet will always be there. I think that is true for the day a gap is created and perhaps as much as three months later, but the “magnet effect” is pretty well dissipated after three to six months. A year or two or three later, as the price approaches an unfilled gap, the “magnet effect” definitely returns. I think it is more of a self-fulling prophecy that anything else.
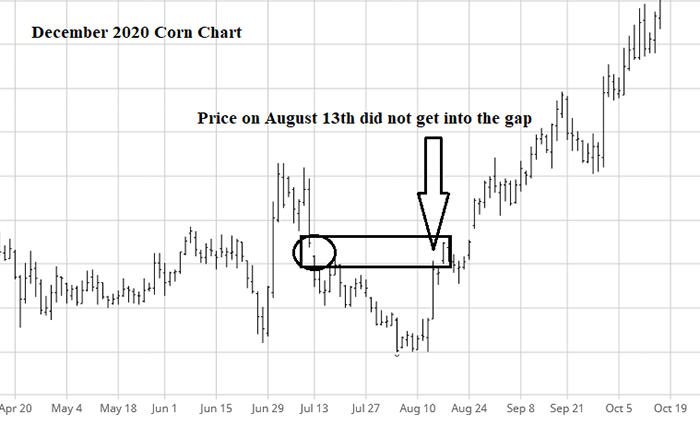
On Aug. 13, 2020 I had a client who wanted to sell December corn at $3.41½, a half cent below the bottom of the gap (a rather aggressive sell order) formed in mid-July, but the high that day was only $3.40¾, so his order to sell at $3.41½ could not have been filled. The settlement that day was $3.38¾. But his order was easily filled two days later when the gap was “filled”, which he regrets to this day.

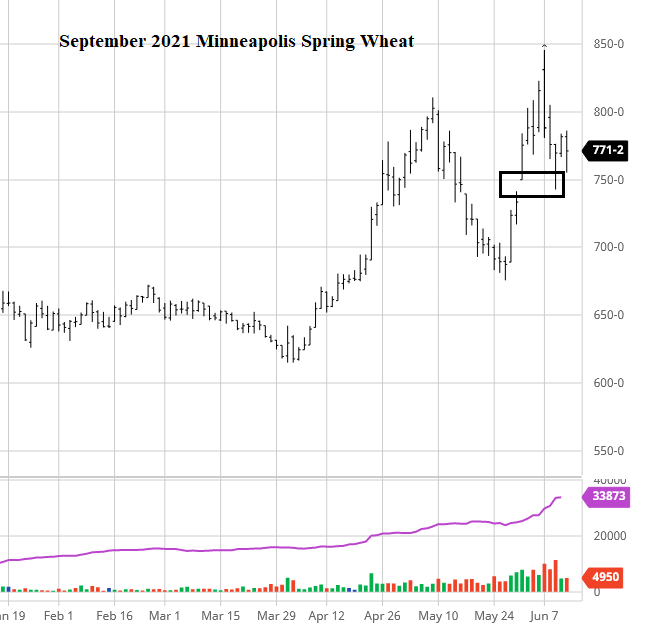
On June 1, 2021, spring wheat gapped higher on the opening leaving a whopping 8½ cent gap. On June 7, September spring wheat was falling like rock from a new contract high of $8.45¾.
A client who wanted to get long (buy) spring wheat recognized that June 1 gap from $7.41½ to $7.50. He placed an order to buy in the gap at $7.42¼, just three-quarters of a cent from the bottom of the gap. It seemed like a good move at the time given the way the price was falling because rain was on the way for the Canadian Prairies.
On June 9, the spring wheat price got deep into the gap, more than a dollar below the contract high made just two days previously and then rallied like a rocket to settle 27 cents above the low for that day.
The guy was a genius, right? Made $1,350 per contract, right? He was a genius, but no, he did make $1,350 that day! The low trade into that gap that day was to $7.42¾, a half cent above his buy order. The rally continued higher the rest of the summer to $9.53. Bummer!
Note the little box to the right on the spring wheat chart below. You can see the gap was almost filled, but not quite. The bottom of the gap was $7.41½. The buy order was at $7.42¼. The market traded into the gap that day down to $7.42¾. A small gap of 1¼ cents was not “filled,” nor was the buy order filled because the order was a half cent below the low for the day.

Wright is an Ohio-based grain marketing consultant. Contact him at (937) 605-1061 or [email protected]. Read more insights at www.wrightonthemarket.com.
No one associated with Wright on the Market is a cash grain broker nor a futures market broker. All information presented is researched and believed to be true and correct, but nothing is 100% in this business.
The opinions of the author are not necessarily those of Farm Futures or Farm Progress.
About the Author(s)
You May Also Like


