The upcoming May 12 USDA supply demand report will probably be the most bearish report we will see this year barring a Black Swan on the demand side. USDA will be using the acreage number they arrived at during the Prospective Planting report as well as trend yields.
Current weather forecasts suggest that exceeding those acreage estimates, as well as attaining trend yield, could be very difficult. For this discussion we will use those numbers, but the reality is that unless weather is perfect from today till the end of the season, these may be the most bearish numbers we trade.
No matter how we look at the numbers, assuming demand remains steady at 15 billion bushels, the only way to avoid ending stocks dropping near or below pipeline requirements would be to increase acres and produce a well above record yield. That is probably the boldest statement I have made in my 43-year career.
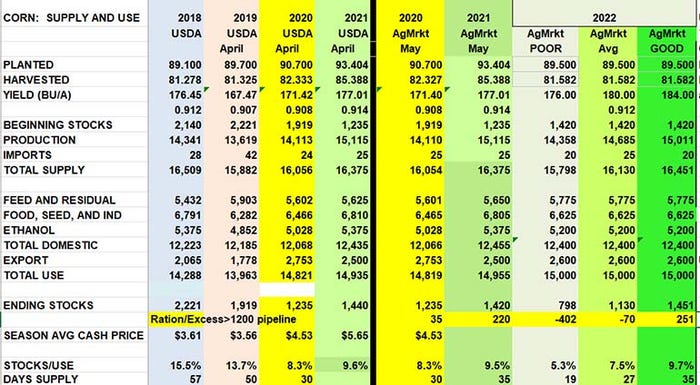
Let's look at the AgMarket.Net supply demand table and focus in on USDA 2020 ending stocks. These were revised down to 1,235 million bushels after eight revisions by USDA to more accurately reflect the tight stocks that the cash market was bidding against and maintaining adequate supply in the pipeline.
This proved that the pipeline requirements to logistically move 15 billion bushels of corn requires 1200 million bushels. We believe now that anything below that number requires some form of rationing by demand to assure enough supply in the system.

Now let's turn our focus to the last three columns, which represent the AgMarket.Net projection of 2022 supply and demand.
Record yield unlikely
Assuming USDA Prospective Planting report is accurate and farmers plant 89.5 million acres, and we use an all-time record of 180 bushels per acre, ending stocks still fall 70 million bushels shy of what we assume is pipeline requirements. Please note that 180 bushel per acre is well above last year's record of 177.01 bushels per acre.
History tells us that a three-bushel jump over previous record yield has a relatively low odds of occurrence. And a record yield two years in a row lowers the odds of that occurrence even more. That statement suggests we have a stronger odds that yields will be below 180 bushel.
Additionally, the planting season has gotten off to a great start along I-80 down to I-72. However, planting is not so good to non-existent in many areas outside of that ban. And although the old timers say “plant in the dust and your bins will bust”, watching farm videos of planters in the midst of a dust storm, or the guy delivering supplies to the field with his windshield wipers on due to dust, makes us really wonder how the western half of the United States will perform.
Jim McCormick in our weekly fundamental video covers soil moisture maps. If any of you have been watching these videos you are well aware of the size and scope of the subsoil deficiencies in the western corn belt and how they far exceed the deficits that we saw last year as well as in 2012. Oddly, those two years are an excellent reminder that one year can be the worst drought in modern history while the other year produced 177-bushel record yield. So it still comes down to pollination and fill weather.
Protect your revenue
The markets continue to demonstrate extreme volatility as we navigate supply and logistic challenges as well as a changing fiscal policy that is creating extreme moves in the financial markets, currencies, and flow of investor money into and out of commodities.
Our weekly fundamental and technical videos often discuss in detail how we are managing risk and per-acre profit potential in the upcoming two years. In our latest report, we demonstrated how a farmer can lock in $400 per acre minimum net profit while keeping the upside open on the bulk of these bushels sold as well as the unsold bushels.
Thus, the revenue curve of the farm remains stable as the market goes down and increases in value as the market goes up. Add insurance to the mix and the revenue curve actually increases as the market goes down as long as you have buy-up programs.
Producers are strongly encouraged to have a plan that assures their operation a healthy profit in case a Black Swan decides to while keeping the operation in a strong competitive position if the markets continue to move higher. We also highly encourage producers to be thinking ahead into 2023 and 2024 as profit margins become large enough to justify multi-year hedges.
History tells us one thing that always happens after extreme price moves. The “market has a long tail.” That saying was coined by weathered and experienced traders because it gives you a visual image that once you kill demand with price, it takes a long time and lower prices to rebuild that demand base.
We like to learn from other people’s mistakes and use wisdom to manage opportunities like the one we are seeing. If you have any questions, please feel free to call one of the AgMarket.Net consultants or brokers for a free consultation.
Reach Bill Biedermann at 815-893-7443 or [email protected].
The risk of loss in trading futures and/or options is substantial and each investor and/or trader must consider whether this is a suitable investment. AgMarket.Net is the Farm Division of John Stewart and Associates (JSA) based out of St Joe, MO and all futures and options trades are cleared through ADMIS in Chicago IL. This material has been prepared by an agent of JSA or a third party and is, or is in the nature of, a solicitation. By accepting this communication, you agree that you are an experienced user of the futures markets, capable of making independent trading decisions, and agree that you are not, and will not, rely solely on this communication in making trading decisions. Past performance, whether actual or indicated by simulated historical tests of strategies, is not indicative of future results. Trading information and advice is based on information taken from 3rd party sources that are believed to be reliable. We do not guarantee that such information is accurate or complete and it should not be relied upon as such. Trading advice reflects our good faith judgment at a specific time and is subject to change without notice. There is no guarantee that the advice we give will result in profitable trades. The services provided by JSA may not be available in all jurisdictions. It is possible that the country in which you are a resident prohibits us from opening and maintaining an account for you.
The opinions of the author are not necessarily those of Farm Futures or Farm Progress.
About the Author(s)
You May Also Like


