
While the September 30 reports were not likely to cause as much neurological damage as what Dolphins quarterback Tua Tagovailoa sustained last Thursday night against the Bengals, it left many of us in the grain market community stumbling for explanations for USDA’s revisions that seemingly came out of right field.
Which is not dissimilar to the NFL’s stance on “player safety” regarding “back injuries” or “concussion protocols.” My ongoing personal dilemma with conflicting feelings about football aside (go Bears), here is a deep dive into Friday’s report findings for corn and soybeans.
Corn stocks minimize worries about demand destruction
Pre-report trade guesses missed the mark by a long shot for both corn and soybean readings for Sept. 1, 2022 quarterly grain stocks readings. This analyst has been especially concerned about demand destruction in the corn market lately as the U.S. cattle herd shrinks, after another bearish week of U.S. ethanol output, and amid a strong dollar limiting U.S. corn’s attractiveness to export buyers.
But NASS proved me wrong! Demand for 2021/22 U.S. corn was actually a staggering 106 million bushels higher than USDA’s World Agricultural Outlook Board had estimated in the September 2022 World Agricultural Supply and Demand Estimates report when it forecasted 2021/22 corn ending stocks at 1.525 billion bushels.
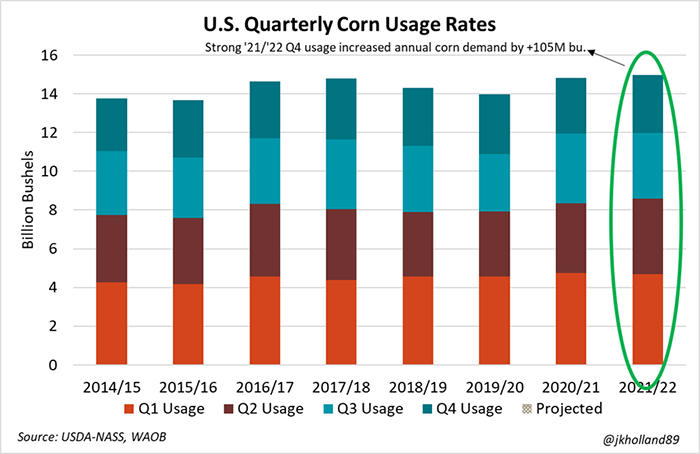
Larger fourth quarter usage rates were a key contributor of the tightened corn stocks. My redneck math finds that 2.969 billion bushels were consumed between June 1 and September 1, 2022, which was actually a 3% increase from year ago paces. The trade had been expecting to see a 1.5% annual decrease in Q4 corn usage prior to NASS’s data release.
I contribute some of this strength to robust ethanol production, especially in those last few days before summer demand tapered and consumers grew increasingly sensitive to higher fuel prices. I’m expecting August 2022 corn consumption for ethanol will likely trend higher when NASS releases its monthly data set on Monday, as June and July consumption was only a fraction (0.01%) higher than year ago volumes.
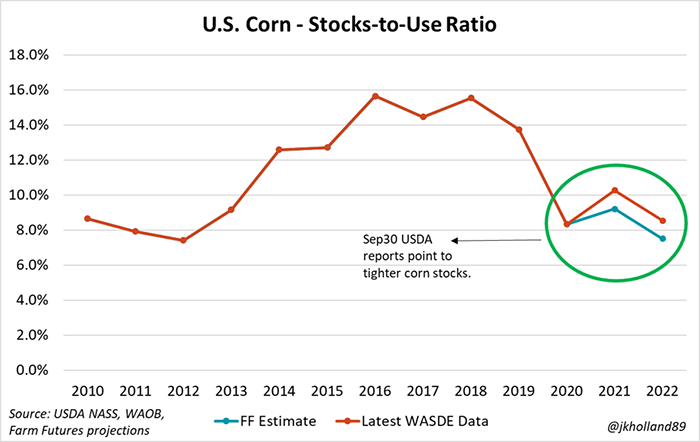
Corn’s stocks-to-use ratio, which measures year-end supply tightness for a commodity, shrunk from USDA’s latest estimate of 10.27% for the 2021/22 to 9.21%. That is the ninth tightest corn supply on record.
And if USDA holds 2022/23 corn usage steady in the October 2022 WASDE report, U.S. corn supplies are likely to shrink even further over the next year. My redneck math puts 2022/23’s STU ratio for corn at 7.5%, which equates to the third tightest supply in U.S. history and suggests bullish price opportunities ahead.
Even with ethanol’s production hiccups over the past month, Friday’s reports were a much-needed bullish omen for growers as harvest season ramps up. The more rapid demand paces imply that farmers may be able to scout higher bids on freshly harvested crops this fall. It also gives farmers more price stability if they are considering booking sales later in the marketing year.
Soybeans to face concussion protocols this week?
It’s no secret that I was bracing for a bullish report on Friday for soybeans. I had good reasons to be bullish – June and July crush rates were 8% higher than a year ago as domestic buyers competed against export markets for U.S. soybeans. Plus, weekly soybean export loading volumes during the second half of the 2021/22 marketing year were double the paces the same time a year prior.
Strong demand suggests higher usage which math’s out to smaller stocks. But this is where I went wrong.
USDA actually added supplies to 2021 soybean production estimates – which is consistent with late season adjustments it has made previously. Example – Brazil’s 2020 crop was adjusted higher months after harvest after a rapid export season (the logic being that if you didn’t grow it, you can’t ship it).
NASS increased the size of the record-setting 2021 soybean crop to the tune of 30 million bushels. NASS accomplished this feat by increasing harvested acreage for 2021 soybeans and boosting yields to 51.7 bushels per acre, which remains the second highest soybean yield in U.S. history.
But on the usage side of the balance sheet, Q4 soybean usage came in lower than expected, as it failed to compete with record-breaking usage volumes in the prior quarter, according to Quarterly Grain Stocks data. As of Sept. 1, 274 million bushels of soybeans were reported on hand – 32 million bushels higher than (and nowhere close to) what the trade was expecting leading up to the report’s release.
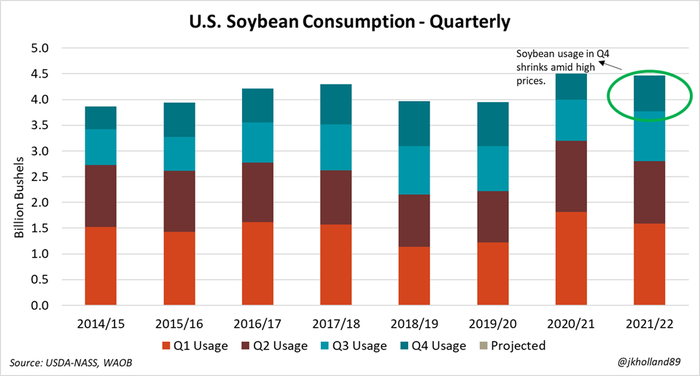
That translates into a Q4 usage rate of 698 million bushels. And while that figure was over a third (36%) higher than year-ago soybean stocks, it brought to light a new set of issues for the U.S. soybean market.
First, 2021/22 usage rates shrunk by 3.6 million bushels in Friday’s report. Old crop soybean consumption was already slated to be lower than its 2020/21 counterpart. But this downward usage adjustment reflected buyer resistance to high-priced U.S. soybeans which unveiled the second issue at play in the soybean market.
The 2021/22 ending stocks-to-use ratio of 5.4% prior to Friday’s report indicated U.S. soybean stocks were at the twelfth tightest on record – a metric that kept bullish price pressure alive for soybean markets. But my redneck math estimates that the new 2021/22 stocks to use ratio for soybeans will likely be closer to 6.1% in the October 2022 WASDE report, reflecting more ample supplies.
That would be the 15th tightest U.S. soybean crop. But it would also give 2022/23 soybean stocks more breathing room. USDA currently has a 4.5% stocks-to-use ratio forecasted for 2022/23 soybean supplies – the fifth tightest on record.
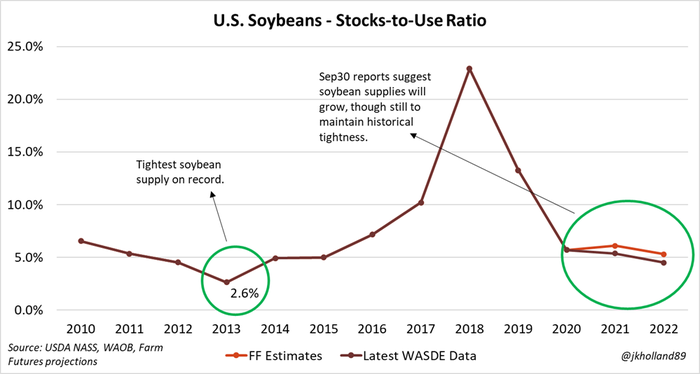
But adding an additional 35(ish) million bushels to 2022/23 beginning stocks and leaving usage unchanged would grow that STU ratio to 5.3% - the 10th tightest soybean supply on record. To be clear, soybean supplies are still tight in the U.S. But this report adds a bit more wiggle room to supplies, which translates to bearish price action.
In essence, the soybean market took a double economic hit in Friday’s report. It gained supply and lost demand, which are both of the key factors that drive bearish price activity. In that regard, it wasn’t dissimilar to receiving two concussions in five days’ time (my last time, I swear. But do better, NFL.).
The Brazilian soybean crop is going into the ground fast this year. And even though the country is receiving widespread rains early in October, a high probability for La Niña weather patterns continues to haunt in the background.
If dry weather continues to favor harvest activity in the U.S. in the coming weeks, Brazil’s crop progress will quickly become the primary supply factor moving soybean markets in the short-term. If the South American soybean behemoth faces any issues, bullish price activity could return to the U.S. wheat complex.
2021 production revisions – out of right field?
As I pointed out in my preview article, the complete marketing year stocks volumes provide the information NASS needs to reconcile usage rates with 2021 production values, which necessitates changes to 2021 production so long after USDA finalized the crop estimates in January 2022.
This year, usage data suggested that last year’s corn crop was 41 million bushels smaller than previously forecast, totaling 15.074 billion bushels, which is still the second largest corn crop in U.S. history. NASS made those adjustments by making slight decreases to 2021 corn acreage and a 0.3-bushel-per-acre reduction to 2021 corn yields.
On the other end of the spectrum, USDA increased 2021 soybean production, as I outlined earlier in this article. Why the late season adjustments? Rapid demand shifts in the second half of the 2021/22 marketing year played a big role. But this was not an unusual revision, statistically speaking.
As NASS’s chief of the crops branch, Lance Honig, pointed out in NASS’s livestreamed briefing to the Agriculture Secretary, the adjustments made to old crop production is part of NASS’s normal practice to review and revise at the close of the marketing year.
With the exception of August 2022 export data expected to be released by the U.S. Census Bureau in the next couple weeks and any potential revisions to the September 1 readings in the January 2023 Quarterly Grain Stocks report, it is likely USDA will have few more revisions for 2021/22 usage rates, though they are not likely to cause as much market gyration as Friday’s reports.
Too soon for 2023 planting intentions…or not?
USDA will not survey farmers for 2023 planting intentions until next March. It will release a modeled forecast of 2023 acreage and usage intentions at its 2023 Ag Outlook Forum in February 2023. So there remains a lot of market uncertainty about how next year’s growing season will shake out, especially amid high fuel and fertilizer costs.
Farm Futures’ August 2023 farmer survey suggests that farmers are already looking to maximize corn acres next spring. Markets already favored corn acres for 2023 ahead of Friday’s reports though soybeans bought back some acres on a smaller 2022 crop and rising input costs for corn over the past month.
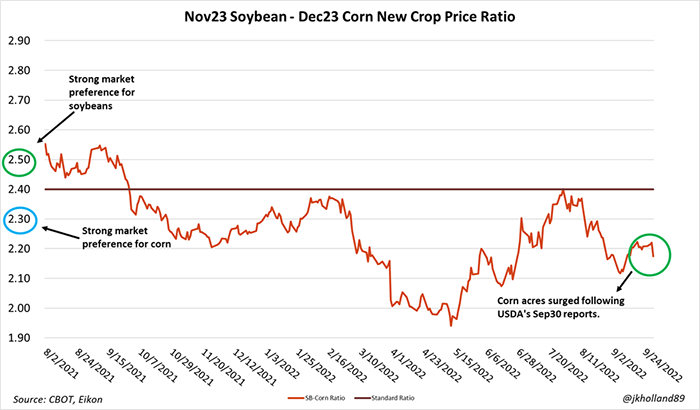
But corn acres remain a clear favorite, according the 2023 new crop price ratio. Friday’s report found the markets buying back even more corn acres in 2023. It will take a big rally in the soybean market to convince farmers to forgo lucrative 2023 profits from corn acres in favor of soybeans, even amid soaring production costs for corn.
But corn markets will need to show more certain signs of demand if this trend is to continue. Lower cattle consumption of corn could be a factor for the lower usage rates, especially as drought has decimated pastures on the Plains and feed costs remain high.
Ethanol output began trending lower towards the end of Q4 2021/22 amid high fuel prices and dropped to 19-month last week, which could also add some bearish prospects to the corn markets in the short-term. A strong dollar and renewed access to Black Sea corn supplies is also limiting export interest for U.S. corn.
Global and domestic supplies are tight. But if corn end users begin to show resistance to buying corn at high prices, those high prices are not likely to stick around for much longer.
About the Author(s)
You May Also Like


