The last full trading week prior to Thanksgiving has wrapped up and the volatility of the week didn’t disappoint.
Soybeans saw the most movement with a trading range on the January contract of 51.25 cents and a settlement 19 cents higher on the week.
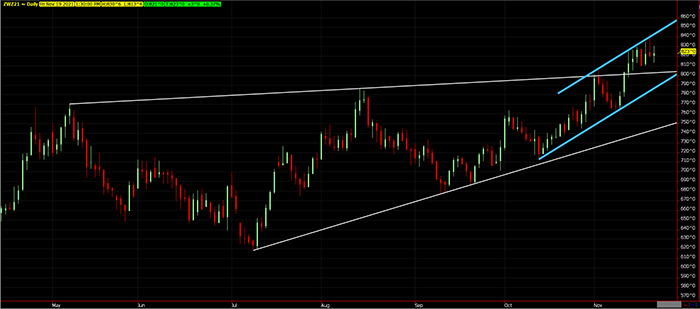
Wheat, like soybeans, traded with plenty of volatility and made new contract highs in three of five sessions for December SRW, while December HRW saw one day this week with a new contract high. However, SRW and HRW were only up 6 and 1.75 cents respectively for the weekly change.
Corn trade was more muted with a 16-cent trading range on the soon-to-expire December contract, which settled 6.5 cents lower than last Friday’s close. Corn was the weak link this week and was unable to accomplish the technical breakout soybeans managed.
Jim McCormick did a great job last week breaking down the November WASDE report and potential changes to look for in the months ahead, so I though it appropriate to look at the market from a technical perspective.
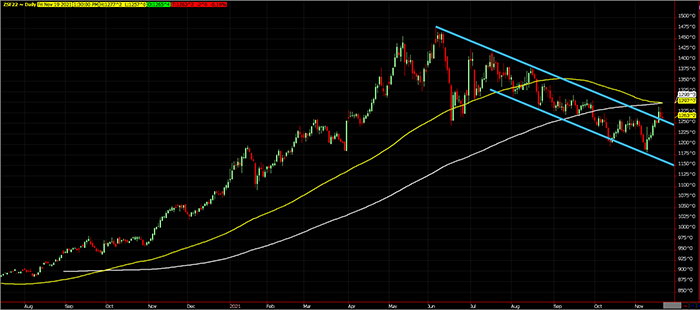
The most important takeaway for the week is what soybeans have accomplished so far, and what a strong close to the month will mean for technicians. January soybeans forged the contract high in June, and up until this week, have been in a well-defined downward trend. That all changed this week with futures breaking through the long-term downtrend and the next major objective is the convergence of the 100- and 200-day moving averages just under $13:

But, potentially more important than that, there is a setup for a major monthly reversal in soybean values. Prior to the November WASDE report release, January soybean futures priced in the expectation for a bearish report and were trading below the lows scored during the month of October on a front-month basis of $11.845. By the end of the week, January soybeans closed above October’s highest price front-month price of $12.625. Finishing the month above $12.625 will solidify the monthly reversal which is generally a signal of a strong bottom.
Wheat is a winner
Wheat has increased in value since the November WASDE report in two of the three varieties, SRW and HRW, while Spring Wheat has lost some of its premium to the other varieties due to a reported increase in stocks on the November WASDE report. SRW is the most-traded wheat contract and was propelled through $8 after the USDA reduced stocks for both SRW and HRW. Since making a strong low on the October WASDE report wheat has traded in an upward trending channel, making another strong low on the November WASDE report, and will now find support at $8 which was previously resistance:

Corn just sat there
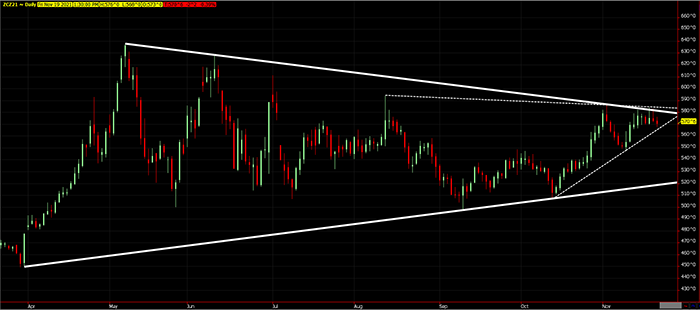
Compared to soybeans and wheat, corn did not accomplish much this week. There were neither new contract highs, nor were and long-term resistance levels breached. But looking ahead, we must acknowledge that corn is at a decisive level that requires close attention.
Corn has both a long-term and short-term downtrend that has capped waves of buying this week; however, the short-term up trend from the October low scored after the October WASDE report is still intact. Should corn make a new high for the month, above the $5.86 high made on Nov. 2, it will also breach both aforementioned downtrend lines which will likely lead to strong technical buying similar to the buying soybeans enjoyed earlier this week. However, a break below this week’s low will breach the short-term up trend which will likely lead to weakness.
Be mindful that the long-term uptrend support is fifty cents below. How corn moves out of this area is likely dependent on whether the commodities can maintain its general inflationary environment.

Option strategies for both downside protection and ownership positions are driven by this type of technical analysis. While it will not predict the future, we can use it to ascertain the price levels that are significant and act accordingly. As always, feel free to contact me directly at 815-665-0463 or anyone on the AgMarket.Net team at 844-4AGMRKT. We are here to help.
Reach Brian Splitt at 847-946-2080 or [email protected].
The risk of loss in trading futures and/or options is substantial and each investor and/or trader must consider whether this is a suitable investment. AgMarket.Net is the Farm Division of John Stewart and Associates (JSA) based out of St Joe, MO and all futures and options trades are cleared through ADMIS in Chicago IL. This material has been prepared by an agent of JSA or a third party and is, or is in the nature of, a solicitation. By accepting this communication, you agree that you are an experienced user of the futures markets, capable of making independent trading decisions, and agree that you are not, and will not, rely solely on this communication in making trading decisions. Past performance, whether actual or indicated by simulated historical tests of strategies, is not indicative of future results. Trading information and advice is based on information taken from 3rd party sources that are believed to be reliable. We do not guarantee that such information is accurate or complete and it should not be relied upon as such. Trading advice reflects our good faith judgment at a specific time and is subject to change without notice. There is no guarantee that the advice we give will result in profitable trades. The services provided by JSA may not be available in all jurisdictions. It is possible that the country in which you are a resident prohibits us from opening and maintaining an account for you.
The opinions of the author are not necessarily those of Farm Futures or Farm Progress.
About the Author(s)
You May Also Like


