At face value, the February WASDE report was slightly bearish versus trade guesses almost across the board, but only by fractional percentages.
If you were bullish, this report would not dissuade you. If you were bearish, you are still fighting a strong trend, but nothing from the report changes your mind, either.
Corn outlook
As for the corn balance sheet adjustments, trade was looking for a 28 million bushel cut for the corn ending stocks, but they made no changes to the old U.S. crop balance sheet. Globally they took 21/22 corn carryout to 302.22 million metric tons, down from 303.07 in January versus expectations of 300.3; they were 292.05 a year ago.
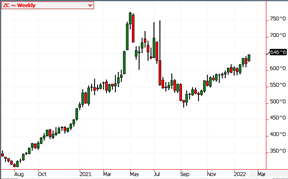
We believe that the path of least resistance is higher for the corn market. Even though the USDA left exports unchanged in February, we will look for demand to come to the U.S. if the South American crop continues to shrink as we and most in the trade believe is happening. An additional 8–10 MMT drop is not out of the question.
Technically the market made a new contract high after the release of the lackluster numbers and looks set up to test last summer highs with any hint of more supply losses. We are hearing reports suggesting that the China COFCO group may be asking for or have bought up to 2MMT of US corn this week.
Lastly, we continue to see investor money flow into the market. With inflation readings at 40-year highs, we see no reason for a slowing of the Wall Street money flowing into the commodity markets, which will continue to help propel the markets higher.

Soybean outlook
Like corn, the soybean adjustments were somewhat muted. There was only one change for the U.S. balance sheet: an increase in crush demand by 25mb, which cut the bottom-line ending stocks dropping from 350mb down to 325mb.
World soybean ending stocks were anticipated to drop around 3.5MMT, with the numbers coming in down 2.4MMT. The average trade guess for Brazil bean production was 133.6, and the USDA came in at 134, which was off 5MMT from the January number.
The average trade guess for Brazil bean production was 133.6MMT, and the USDA came in at 134, which was off 5MMT from the January number.
Many in the trade believe that this is the first step of many cuts to be made to their crop size. Several in the private sector feel Brazil's bean production is below 130MMT, with some projecting it to fall to the low 120s when it is all said and done.
In Argentina, the trade was looking for a 2MMT cut to production, and they got a 1.5MMT cut from 46.5MMT down to 45MMT. If the South American crop size continues to falter, we anticipate that the lost production will equate to higher U.S. demand as food demands are relatively inelastic as we all need it to survive.

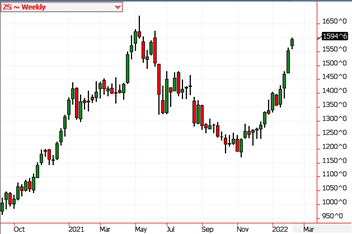
Like the front-month corn contract, the March Soybean contract made fresh contract highs after the release of the February WASDE numbers. Technically this opens the door to test last year's contract high of $16.77 ½.
Manage risk
We encourage producers to consider using options as a way to manage both upside and downside risk. The cost of the options will not be cheap, but they do provide an easier way to manage risk as we look for the volatile market swings that we have recently seen to become more extensive and violent as we move deeper into the calendar year.
If you have questions, feel free to contact me directly at 815-665-0461 or anyone on the AgMarket.Net team at 844-4AGMRKT.
The risk of loss in trading futures and/or options is substantial and each investor and/or trader must consider whether this is a suitable investment. AgMarket.Net is the Farm Division of John Stewart and Associates (JSA) based out of St Joe, MO and all futures and options trades are cleared through ADMIS in Chicago IL. This material has been prepared by an agent of JSA or a third party and is, or is in the nature of, a solicitation. By accepting this communication, you agree that you are an experienced user of the futures markets, capable of making independent trading decisions, and agree that you are not, and will not, rely solely on this communication in making trading decisions. Past performance, whether actual or indicated by simulated historical tests of strategies, is not indicative of future results. Trading information and advice is based on information taken from 3rd party sources that are believed to be reliable. We do not guarantee that such information is accurate or complete and it should not be relied upon as such. Trading advice reflects our good faith judgment at a specific time and is subject to change without notice. There is no guarantee that the advice we give will result in profitable trades. The services provided by JSA may not be available in all jurisdictions. It is possible that the country in which you are a resident prohibits us from opening and maintaining an account for you.
About the Author(s)
You May Also Like


