Last week’s blog was about gaps, which are fairly common. A commodity futures contracts will have three, maybe four gaps in the two or so years a given contract trades.
What is much more unusual is a breakaway gap, which is caused by a strong price movement through major support or resistance resulting in a definitive change in price trend.
Remember, technicians will tell you markets always trade in a trend, namely up, sideways, or down. One of the keys to improving your marketing is to know how to recognize immediately when a trend change has occurred.
Why moving averages matter
A moving average (MA) is the average price of a commodity for “x” number of days plotted on a bar chart. The 100-day or 200-day MA lines are formidable lines of support or resistance because they are a summary of long term price averaging. If the market is trading above the long term moving average, that MA is a line of support as more and more buy orders will be waiting to be filled as the market moves down toward MA.
Likewise, a market trading below a 100 or 200-day the moving average line will encounter major resistance as the price trades closer and closer to the MA line.
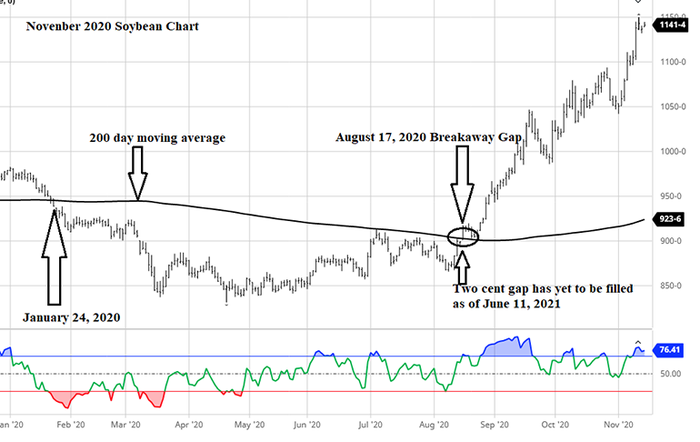
On July 6, 2020, after almost six months below the 200-day MA, November 2020 soybeans traded up to and touched the 200-day moving average, but failed to move above that formidable line of resistance. Five days later, November beans were 37¼ cents lower. The failure of the beans to break the resistance at the 200-day MA attracted a lot of new sell orders.
On Aug. 12, USDA came out with a very bearish set of numbers. The yield was increased from July’s 49.82 bushels to 53.3, far more than expected. The carryover was increased from a relatively tight 36-day supply to a burdensome 50-day supply and the national average price expected to be paid to farmers was reduced 15 cents to $8.35. Worse yet, the crop was essentially made, harvest was just a month away, and the seasonal price trend was down until Oct. 10.
The day the USDA numbers were released, November beans traded 36 cents below the 200-day MA. Amazingly, November beans settled 9½ cents higher that day at $8.83, just 20 cents below the 200-day MA. While that was a very impressive close, with the added bearish fundamental news, the chances of trading above the 200-day moving average until after harvest was the kind of stuff fairy tales are made from.
Three trading days later, November beans gapped higher on the opening at the 200-day MA of $9.01 and raced higher, leaving a two cent breakaway gap. A few days later, the price traded down to the 200-day average, which had become technical support, which held -- and the price was in an uptrend for ten months! Take a look at the chart with the breakaway gap:

A lot of farmers sold 2020 beans in the days after that Aug. 12 Supply and Demand report. I had been saying for a year November 2020 beans would get to $10, but I had to face the facts after the August report: crop made, seasonal trend down, huge carryover with the 200-day moving average overhead, and just a few cents above the current price. I told clients to give up on $10 beans until maybe 2021.
Many market advisors were telling their clients to sell beans. I did too for a couple weeks or so. Had I known the power of a breakaway gap, I would have done things differently.
When beans had that breakaway gap on the 17th, all those sold beans should have been bought back by lifting the hedge, buy futures or calls, or bull spreads.
Market clues
I can’t emphasize this enough: the market tells us when it thinks the carryover is getting larger or smaller and the language it uses is technical analysis. Without a doubt, in the long run, the market is always right. That breakaway gap on Aug. 17, 2020, told us that price trend had changed from sideways to higher, but most of us could not understand the language.
What happened to USDA’s projected 50-day carryover for the 2020 crop? By May 2021, the USDA projected there would be enough 2020 beans to meet the needs of the USA for only 10 days. Old crop futures traded to $16.67, more than double the contract low price made in April 2020.
Score that: Technical analysis 1, USDA 0.
Wright is an Ohio-based grain marketing consultant. Contact him at (937) 605-1061 or [email protected]. Read more insights at www.wrightonthemarket.com.
No one associated with Wright on the Market is a cash grain broker nor a futures market broker. All information presented is researched and believed to be true and correct, but nothing is 100% in this business.
The opinions of the author are not necessarily those of Farm Futures or Farm Progress.
About the Author(s)
You May Also Like


