

Subscribe to receive top agriculture news
Be informed daily with these free e-newsletters

Ag Marketing IQ: Winter wheat suffers but what will crop tools say about corn and soybeans?

USDA’s May 12 reports feature the agency’s first monthly forecasts for 2023 crop supply and demand in the U.S. But tables for row crops like corn and soybeans won’t include hard data on production. Instead, those yields in the World Agricultural Supply And Demand Estimates are based on statistical guesses and planting intentions published at the end of March.
While fall-harvested crops are just getting started, the May WASDE presents results of the government’s first survey of winter wheat farms to assess yields and harvested acres. This year the numbers will be of more than passing interest. With U.S. winter wheat conditions among the worst ever, supplies remain very much in doubt.
Analysts aren’t completely in the dark about prospects for production, thanks to a variety of tools. Some, like yield estimates based on weekly Crop Progress ratings, are tried, and sometimes true – the time series goes all the way back to 1986.
Other methods based on satellite imagery are less widely known, but also provide clues. And even if you’ve never planted an acre of wheat, corn and soybean growers can use these high-tech tools this summer to zero in on how their fields compare to neighbors in their county and other growers around the country and world.
Gaining that type of perspective can be critical to making marketing decisions, helping avoid the “my backyard syndrome.” Whether your fields are wilting or flourishing may not make any difference in the big picture of total production that drives prices higher or lower.
USDA’s May winter wheat estimates provide the first ground truth for these tools. Yield guesses based on crop ratings and satellite maps are good enough to be statistically significant – that is, not the result of mere chance. Still, they account for less than two-thirds of the variance in yields, leaving plenty of room for a USDA surprise.
USDA last week said only 28% of the crop was in good or excellent condition, only 1% better than a year ago and the fourth lowest reading ever for this time of the season. That’s bad enough, but yield estimates made from the numbers don’t point to a historic disaster. My models show yields nationwide between 45.4 and 46.7 bushels per acre, down around 8% to 10% from the 50.9 bpa expected.
The backyard effect could also show up in the May numbers. Growers in the biggest winter wheat state of Kansas may think prospects are far worse, based on how their fields are faring. Just 13% of Kansas wheat is in good/excellent shape, nearly half last year’s reading in late April and early May. Ratings put the Kansas yield at just 28.2 bpa. If it holds, that would be the third worse crop in the state’s history.

Not all my wheat models are so pessimistic. Vegetation health maps produced by U.S. satellites show somewhat better prospects, though still below average for this time of year. These put the U.S. yield around 48 bpa, with Kansas as low as 34 bpa.
Geographic information system products are still somewhat new, and don’t yet have the status among traders conferred on USDA’s reports. To be sure, lots of farmers and analysts criticize Crop Progress ratings, but they’re still closely watched. And USDA’s official production estimates, published by its National Agricultural Statistics Service have plenty of nay-sayers too. But they remain the gold standard in the industry.
Still, the vegetation indexes deserve attention. Consider their performance this winter in predicting disastrous results from severe drought suffered by corn and soybean growers in Argentina. In its February WASDE, USDA cut its estimate of Argentine corn production to 1.72 billion bushels as La Nina conditions punished fields. But the Vegetation Health Index from NOAA’s Center for Satellite Applications and Research, or STAR, was already sounding much louder alarms, pointing to a crop of just 1.2 billion bushels. USDA’s last estimate in April put the crop at 1.36 billion.

One benefit to these products is the ability to see how crops are faring compared to normal, as well as tracking changes from week to week. These tools also generate numbers for current readings that permit historical comparisons needed to make forecasts.
This is especially useful for international production. It’s one thing to read a wire service story about the Argentine drought. But seeing what’s happening on a fairly granular display or data table provides a more objective assessment.
A good place to start is with the STAR Global Vegetation Health Products webpage, which provides access to national and international Vegetation Health indexes, and the Normalized Difference Vegetation Index. Time series for this weekly data goes back in some cases as far as 1982, allowing for comparisons from week to week and year to year.
This tool also drills down to state-level indexes for specific crops. Besides charting results this data can be downloaded for use in spreadsheets to forecast yields.

Another satellite product, this one from USDA and NASA, gives an even more detailed view. The GIMMS Global Agricultural Monitoring, or GLAM, bores down all the way to the county level to show how specific crops are faring. This is especially useful if you need a gut check for selling rallies this summer. And, if your yields usually track the county’s, downloading the data tables behind the images can double check your own’s fields’ potential before traditional yield checks are made later in the growing season.
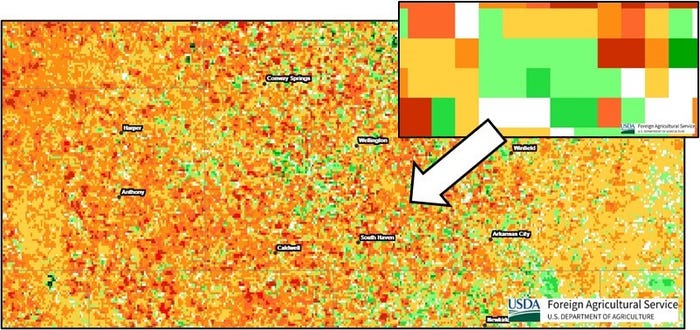
Current winter wheat readings for Sumner County, typically the largest producer in Kansas, illustrate how disasters aren’t equal. Maps suggest winter wheat yield losses of 25% compared to expected. That’s bad, but not nearly as bad as the worst years, such as 2007, when production was nearly 60% below normal.
A tool put out by USDA’s Foreign Agricultural Service gets even deeper into the weeds. The Global Agricultural & Disaster Assessment System goes all the way down to 10-meter resolution or less, more than enough for looking at individual fields if you know their geocoordinates.
This data is updated weekly, not real-time but close to it. So, with a good enough computer and some time, growers can analyze statistics for their own fields as well as others.
None of these methods of forecasting yields is a silver bullet. Some work some years and not others. Still, it’s better than guessing or listening to coffee shop talk. And while the view from 30,000 feet is good, the picture from even higher above the earth can provide balance for emotional marketing decisions.
Sumner County, KS VDVI
Knorr writes from Chicago, Ill. Email him at [email protected].
The opinions of the author are not necessarily those of Farm Futures or Farm Progress.
You May Also Like
Enter a zip code to see the weather conditions for a different location.


