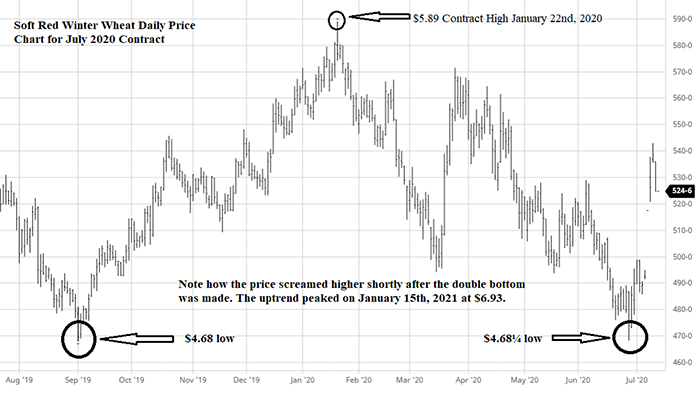
On Sept. 3, 2019, CBOT (Soft Red Winter) July 2020 wheat futures contract made its contract low at $4.68.
On Jan. 22, 2020, that contract made its high at $5.89.
On June 26, 2020, it traded down to $4.68¼.
Take a look at the daily price chart for July 2020 wheat below. This chart formation is what is called a “double bottom” because the price dipped to the same price twice several months apart.
Double bottoms are considered major areas of support. An area of “support” is where there will be more and more buy orders as the market moves closer to that lower price. The additional buy orders absorb the sell orders and slow the price decline.
Double bottoms at contract lows or multiyear lows on the long term chart are considered to be one of the most reliable bottom indictors, a trend changer, as the price turns higher for at least awhile. This particular double bottom sent soft red winter wheat $2.25 higher to $6.93 four months later.
However, don’t be thinking if a double bottom is a reliable indicator of a trend change, a triple bottom is even more reliable. I cannot remember a single time a triple bottom stopped a price decline.
Recently, I wrote a blog to explain Head and Shoulders Formations. There is one in this chart. It also indicated a trend change. It is right there in front of your eyes. Do you see it?
I say again, technical analysis is the language the market speaks to tell us what it thinks a given price will do. We need to learn that language to be better marketers of our production.

Wright is an Ohio-based grain marketing consultant. Contact him at (937) 605-1061 or [email protected]. Read more insights at www.wrightonthemarket.com.
No one associated with Wright on the Market is a cash grain broker nor a futures market broker. All information presented is researched and believed to be true and correct, but nothing is 100% in this business.
The opinions of the author are not necessarily those of Farm Futures or Farm Progress.
About the Author(s)
You May Also Like


