One of the technical indicators of significant value is a gap on the daily price chart of vertical bars showing the high and low price range traded for each day.
A gap is created on the daily price chart when the highest price of one trading day is lower than the lowest price for the next trading day.
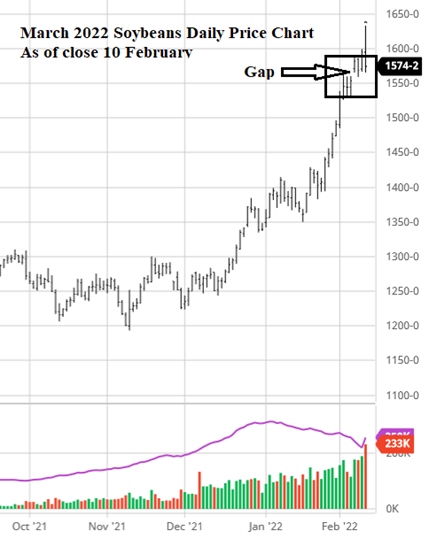
On Feb. 4, 2021, March 2022 soybeans made a high of $15.60¼. On Sunday evening, March soybeans “gapped higher” leaving a gap on the daily chart of 5 cents between $15.60¼ and $15.65¼ and went on settle $15.81¾, up 28¼ cents on the day. The next day, the gap was filled when March beans traded down to $15.59, but closed well above the top of the gap. March beans made a new contract high Monday and Wednesday.
After the close Wednesday, our Wright on the Market technician wrote:
“The soybean market has gained $4.15 since the Nov 9 low. Three months is historically a very big run for beans. Many reasonable folks feel like a significant correction is in order. Perhaps, but the truth is the market will tell us. The gap higher on the Sunday night opening is either an exhaustion gap, which means a correction of 2-4 weeks is in order, or it is a measuring gap that projects to either $17.79 or $19.74 in the coming few weeks to a few months, depending on which swing low is used. We should have a good idea by Friday’s close.”
A memorable day
Thursday’s was a day some folks will long remember. The trading range for March beans was 67½ cents with a high of $16.33 and a settlement of $15.74¼, a whopping 58½ cents below the high for the day and down 20½ cents on the day.
To me, after Wednesday’s close, that gap felt like a measuring gap, but after Thursday’s trade, that gap feels like an exhaustion gap. I am looking forward to tomorrow evening to see what our Tech Guy has to say: Exhaustion or Measuring Gap? Here is the chart after Thursday’s (Feb. 10) trade.

Wright is an Ohio-based grain marketing consultant. Contact him at (937) 605-1061 or [email protected]. Read more insights at www.wrightonthemarket.com.
No one associated with Wright on the Market is a cash grain broker nor a futures market broker. All information presented is researched and believed to be true and correct, but nothing is 100% in this business.
The opinions of the author are not necessarily those of Farm Futures or Farm Progress.
About the Author(s)
You May Also Like


