Big moves in grain futures are a regular part of the trading landscape. Price limits, which wheat breeched on multiple days after Russia invaded Ukraine, are reset twice a year at 7% and can expand 50% daily until the market trades freely.
So, a farmer might look at the 5% rally in the stock market Nov. 10 and wonder what’s the fuss. But last week’s gains were eye-popping. And their cause, a small but unexpected cooling in red-hot inflation, had the opposite impact on corn and soybeans, which suffered double digit declines.
While it’s tough to know what really moves markets from one day to the next, “smart” money moving out of commodities into stocks may have contributed to the downturn in futures. Food accounts for roughly 15% of the Consumer Price Index. Along with a surge in energy costs, food prices were a big part of the inflation story gripping the economy in 2022.
Grain futures both benefited from those inflation headlines, and helped cause them, too. But beyond the chicken-or-egg debate, it’s easy to worry that lower consumer prices could become a long-term bearish factor for ag markets. How worried should you be?
The answer? As the saying goes, it’s complicated. And there will be math. But both true believers and agnostics about inflation’s impact on corn prices can find support for their positions.
Rural America isn’t counted
First, some background on the CPI. While the food and energy you produce affects the index, your lives otherwise probably are not part of it. Data is gathered only from “urban” consumers – the 93% of Americans that don’t live in rural areas.
The Bureau of Labor Statistics doesn’t publish just one CPI, but dozens of them featuring various statistical adjustments for different items, groups and areas. Another version strips out food and energy costs, which fluctuate up and down more than less volatile components. And the Federal Reserve historically has favored yet another measurement, Personal Consumption Expenditures, put out by another wing of the government, the Bureau of Economic Analysis.
The so-called “headline” number on inflation is for All Urban Consumers, the CPI-U, which rose 7.7% in October. That number is the annual change, comparing October 2022 to October 2021. The increase from September to October of this year was .4%.
These percentage changes compare readings on raw indexes that go all the way back to 1914 – the start of the so-called parity era for farm prices. Bernie Sanders campaigned on the issue back in Iowa during his last bid for the presidency, so it’s a topic that still pops up.
Joined at the hip?
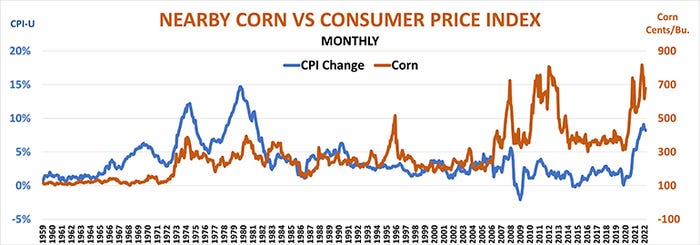
To assess inflation’s impact on corn, and vice versa, I looked at data going back to 1959. Corn was $1.20 back then on a good day and the raw CPI-U index was 29.15. Corn topped $8 in May, while the latest CPI-U index was 298.062. More than six decades of inflation swelled the index over time. Corn prices fluctuate more wildly up and down, but trended higher overall as demand from exporters and domestic users grew.
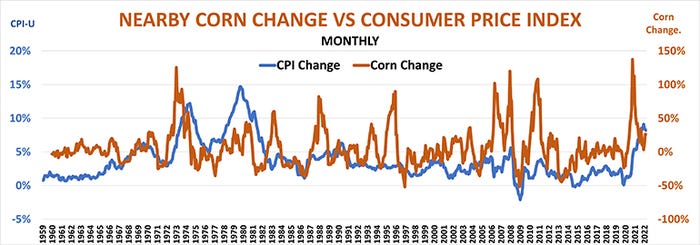
On the surface, there does indeed appear to be a connection with the raw index and corn, which account for about half of the variance between the two. But most of this is just a function of both measures rising over time. Monthly changes in corn and the CPI reflect only 5% of the variance in the fluctuations.
The charts below show how these ups and downs played out, comparing the CPI-U to both corn prices and changes from month to month.


The extreme peaks and valleys on the charts make it easy to understand why some folks believe inflation benefits farmers. The lines also show how corn front-runs inflations sometimes, while following it other times.
But there are plenty of years when corn exploded and the CPI treaded water.
That doesn’t mean you should ignore inflation data, for two important reasons. First, there are times when corn and the CPI are joined at the hip, most recently the bull market of 2020-2022. Perhaps even more important is inflation’s impact on other markets that affect your business and marketing strategies.
Supply and demand matter
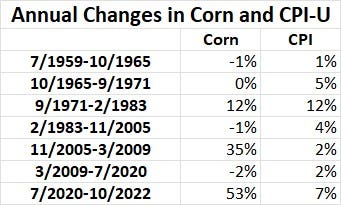
The table below breaks down this complicated relationship between inflation and corn. During the inflation era from the 1970s into early 1980s, both corn and the raw CPI-U rose at annual rates of 12%. The pandemic-fueled price spike saw the biggest inflation in the following 40 years. While the annualized CPI from July 2020 to October 2022 was 7%, corn prices rose 53% per year.

Periods of low inflation saw both higher and lower corn prices. From November 2005 to March 2009 corn prices surged 35% thanks to the ethanol boom, despite tame inflation, another reminder that weather and demand still rule the futures game.
Follow the money
The second fallout from the CPI print could also be significant. Last week I noted how investors feared the Federal Reserve’s aggressive monetary tightening to control inflation could raise short-term interest rates as high as 5.5%. The October CPI changed that narrative, with the average betting on Federal Funds Futures seeing a peak below 5%.
That could be a double dose of good news. Lower interest rates impact not only your cost of production, but the ripple sent a tidal wave through the currency market. After hitting a 20-year high in September, the dollar index dropped more than 7%. This might be just knee-jerk profit taking from dollar bulls or short-covering from traders who had sold other currencies against the greenback. But if the Fed does indeed begin to put the brakes on its acceleration, investors may start selling dollars in earnest, believing a long-term shift is underway, because money tends to flow towards currencies of countries offering a higher yield on their debt.
The Fed didn’t start tracking the dollar until the U.S. went off the gold standard in the 1970s. But both the decade that followed and the COVID boom showed the dollar affecting grain prices, though again, it’s not a simple story. As the second year of the pandemic unfolded a weakening dollar gave added lift to corn’s big rally, which kept going despite a return to the greenback’s strength. But the currency’s gains this year as interest rates rose intensified corn’s recent foundering.
In addition to watching grain and financial markets for data, monitor what big speculators do. The CFTC’s Commitment of Traders showed increasing bullish bets in corn into the first of November. But daily totals since mostly featured selling, even before the CPI came out. If that trend continues, it could add headwinds to rally hopes.
Knorr writes from Chicago, Ill. Email him at [email protected]
The opinions of the author are not necessarily those of Farm Futures or Farm Progress.
About the Author(s)
You May Also Like


