Caesar had the Ides of March. Corn traders beware of the middle of May.
Planting progress by May 15 is a key variable in the model USDA uses for predicting “normal” yields, as I wrote earlier this month. Planting pace alone won’t make or break a crop. But it can affect the impact of summer weather for better, or worse.
May 15 is important for another reason. My long-term study of storage strategies suggests it’s a good time to consider opportunities for hedging new crop, especially with December corn and November soybean futures hovering below all-time highs from 2012.
FOMO always makes pulling the trigger hard, and historic uncertainty heightened by pandemic, inflation and war won’t make selling any easier. That’s why my study of key spring and rally windows includes options strategies, as well as straight sales with futures or hedge-to-arrive cash contracts.
Using options can provide another kick at the can if prices keep rising after their purchase. Buying a put, for example, conveys the right but not the obligation to sell at a specific strike price. If prices rise enough the put can be liquidated and rolled into a cash sale or another put with a higher strike price.
As with all things that sound good, there’s a catch: The premium to buy this price insurance must be paid upfront. The put’s value likely will go down if futures keep rising, and will also lose time value the longer the option is held.
There will be math
The inner workings of options calculations aren’t for those with math phobia. Options are three-dimensional chess games played in a world of hypothetical risk where certainly, not to mention value, is only approximate. In addition to time, the number of days until the option expires, and the price of the underlying futures contract, premiums are influenced by the level of uncertainty in the market among other factors.
Consider insurance underwriters. They charge more for a policy on your house if you live in an area prone to disasters like wildfire or flood. A policy for a month costs less than a policy for year or two, and a mansion on a lake costs more to insure than a trailer in a mobile home park.
It all adds up to risk, a factor that’s all too alive and well in most markets around the world right now. Wild swings in energy, stocks, bonds and currencies are as commonplace as the moves seen in corn and soybeans. This uncertainty increases the cost of options, and it has a name: implied volatility.
Fortunately, there are plenty of online options apps to do the heavy lifting with these calculations. The CME Group’s QuikStrike tools are one place to start.
However you discover the numbers, knowing what implied volatility is can help you decide if the insurance is worth the cost because this statistic also reveals clues about where prices could ultimately be headed.
Volatility is defined as the standard deviation of annualized log-normal returns, expressed as a percentage. Using log-normal returns allows for the evaluation of days with losses instead of gains, while standard deviation is a primary concept of statistics.
If you, or your children or grandchildren took AP math in high school or statistics in college, you learned this. It’s not rocket science, but it’s a little more complicated than 1 + 1 = 2.

Will corn hit $11?
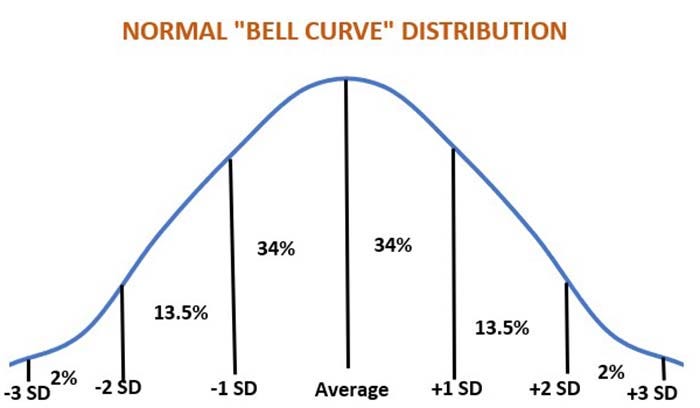
In this theory, prices are distributed following the pattern of the classic bell curve. Most days the prices will be nearer to the average, or mean, than farther away at the tails. In a normal distribution, 68% of the prices will fall within one standard deviation of the mean – 34% above and 34% below. Two standard deviations should account for 95% of the prices, and nearly all – more than 99% -- should fall within three deviations.
This type of calculation looks backward at what has happened, which is why it is called historical volatility.
The implied volatility used by options traders attempts to figure not what was, but what will be. In other words, how much could prices move, up or down, in the future.
Here’s an example from last week. With December corn futures around $7.36, an at-the-money put option for the right to sell at $7.40 costs around 73.5 cents. Buying the put guaranteed a futures selling price at expiration Nov. 25 of $6.665 – the $7.40 strike price less the option cost of 73.5 cents.
That put costs a whole lot, but it could be worth it if price movements are violent. Implied volatility can help with this assessment.
Implied volatility for the option was 33.4%. [For those who want a DIY solution, implied volatility can be approximated by multiplying the options premium divided by the price of its underlying asset by the square root of two times pi (3.1416) divided by the number of days until expiration divided by 365].
Remember that implied volatility is the standard deviation accounting for 68% of expected price movements. Multiplying the implied volatility times the underlying futures prices times the square root of the number of days until expiration divided by 365 yields the expected price range for 34% above and below the current level. In this case, the standard deviation amounts to $1.84, so the expected range 68% of the time should fall between $5.52 and $9.20. Two standard deviations, a range of $3.68, provides a range between $3.68 and 11.04. that should account for 95% of the trading days.
Put another way, the market believes there’s chance, though very small, of $11 corn before December options expire Nov. 25. If that seems far-fetched, consider the old crop corn market in 2021-2022.
It’s happened before
Back at harvest on Oct. 1, July 2022 corn closed at $5.55. The $5.50 call cost 46.375 cents. Implied volatility of 23.5% put the standard deviation at $1.11. Two standard deviations put the top of the 95% price range at $7.77. The contract high so far for July 2022 is $8.245, showing just how unusual the old crop rally was. Buying the call might have looked like a stretch, but it paid off.
Soybean volatility in mid-May typically is not extreme as for corn and that’s also the case this year. Last week with November futures at $14.86, an at-the-money $14.80 put traded for 88 cents, a net guaranteed selling price of $13.92. The contract’s implied volatility of 21.8% produced a standard deviation of $2.22 with a 68% price range of $12.65 to $17.08. The 95% range of $4.43 was $10.43 to $19.30.
As with beauty, the value of these options is in the eyes of the buyer and seller. There are plenty of other hedging strategies as well to eliminate some of the price risk in the market. Out-of-the-money puts and calls can be sold to finance the purchase of a put, though these trades may involve futures margin exposure. A portion of the crop can be sold, providing downside protection on priced bushels while leaving upside open on the rest. Shorter duration options can also be used, though the protection offered won’t last as long as harvest delivery contracts.
The key with any decision, or even doing nothing, is to know what you’re buying and selling. That isn’t always easy with options. But as the fine print says, “buyer beware.”
Knorr writes from Chicago, Ill. Email him at [email protected].
The opinions of the author are not necessarily those of Farm Futures or Farm Progress.
About the Author(s)
You May Also Like


