Like Scrooge in “A Christmas Carol,” farmers get a vision of the past, present and future when USDA releases its biggest data dump of the year later this week, Jan. 12.
The blizzard of numbers are known for producing market-moving surprises, with a wide-ranging collection of what was, what is, and what could be.
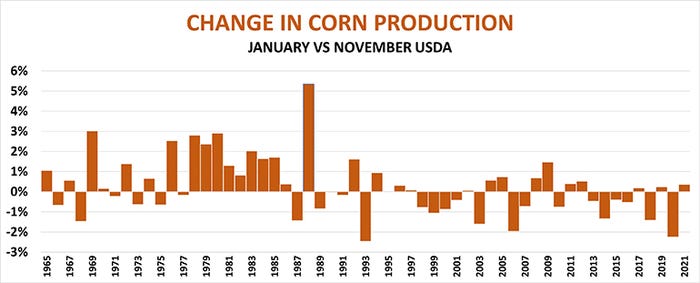
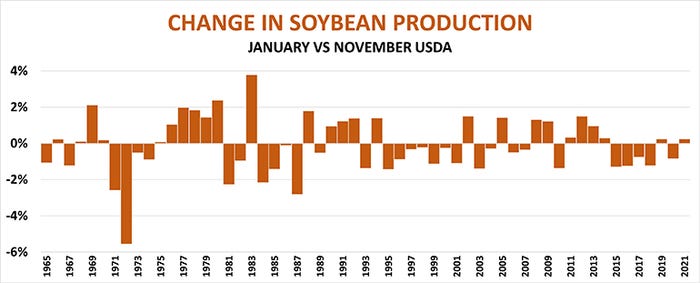
The ghost of the past growing season comes from the annual estimate of corn and soybean production, the agency’s last monthly take on the size of the 2022 crops. Acreage and yields could change, but the bottom line will be the number of bushels produced. USDA’s track record since 1965 offers some clues, though nothing definitive on what to expect.
Corn production increased in January from November in 31 of those years, decreased 25 years and was unchanged once. The soybean trend was just the opposite, rising 26 years and falling 31. Neither of these was large enough to be statistically significant, that is, the result of something other than mere chance.
While there have been some big changes in the past, recently the differences have been around 2% or less. Both crops show a slight tendency over the past decade for production to fall slightly in the January report, but this also is not enough to be meaningful.


Yield questions
The 2022 growing season was a challenging one in many areas, perhaps making the outcome more uncertain. Disagreement between different methods of forecasting yields also raise doubts, especially in corn.
USDA in November pegged the nationwide corn yield at 172.3 bushels per acre, nearly 5 bpa below the 177.1 projected from the trend over the past 20 years. The government’s estimate was spot on with the forecast produced by Vegetative Health Index data, which came in just a tenth of a bushel higher.
Estimates produced by a popular model using growing season weather were more optimistic, raising the yield to 174.3 bpa. Losses filed through the end of 2022 by farmers with crop insurance also point to more promising yields, though claims could be coming in still for months.
Nationwide ratings from USDA’s Crop Progress reports put only 53% of the crop in good or excellent condition, the lowest since the 2012 drought year, suggesting yields as low as 167 bpa. But when state-by-state results are viewed, yields look very close to USDA’s November number.
Soybeans could be set up for the biggest surprise, and it could be a bearish one. USDA put the average U.S. yield at 50.2 bpa in November, more than 2 bpa below the 20-year statistical trend. Models based on weather, the VHI and nationwide crop ratings were in line with the higher trend yield, though state-by-state results were a little lower but still 1.4 bpa above USDA.
Stocks shocks
Crop production is one of two components featured in the other report about the past, Quarterly Grain Stocks, which have been difficult at times for analysts to forecast. For the Dec. 1 number, supply is production is added to left over inventories from the 2021 marketing year, plus imports. Disappearance, the government’s version of demand, can be tricky to estimate for both corn and soybeans.
Major categories of usage are fairly well documented by other reports, including exports, corn turned into ethanol and soybeans crushed by processors.
The tough nut to crack is how much corn was fed to livestock, a number USDA doesn’t even try to get from farmers. Instead, the amount of corn walking off the farm is deduced from what wasn’t accounted for from ethanol production, seed, food usage and exports. Most of this was turned into animal protein, but this category also contains “residual usage,” which is used to clean up statistical error that’s always present in survey based data, especially of production.
Using USDA’s November crop estimates, Dec. 1 corn stocks should come in around 11.17 billion bushels, the lowest reading for the quarter since 2013.
The residual usage number for soybeans is even more of a mystery. It tends to be large in the September-November quarter measured in this report, but subsequent quarters can see negative usage. Changes or surprises in the past were a tip off that the size of the crop was different than the January estimate, a matter USDA may not clear up until the end of September.
Based on USDA’s November production, Dec. 1 soybean stocks should be around 3.1 billion bushels, less than a year ago but significantly more than in 2020.
The here and now
Two reports out Jan. 12 assess the current situation of crops out in the field. Winter Wheat Seedings is USDA’s first estimate of what farmers planted last fall as drought parched many fields in the western half of the country.
USDA’s first winter wheat ratings of the season at the end of October put just 28% of the fields in good or excellent condition, the lowest for the week on record. These national reports showed a little improvement before ending in November. Updated monthly numbers from some states reported last week showed a few more gains, though conditions in Kansas remain very stressed.
Vegetation Health Index readings from Kansas were more upbeat, however. And in any case, progress and VHI data doesn’t become a useful tool for predicting yields until spring, when the crop is no longer dormant. Low ratings could ultimately mean higher abandonment, at a minimum, but are hard to interpret in the dead of winter.
USDA’s other current assessment Jan. 12 is World Agricultural Production, which sheds light on how crops in the southern hemisphere are faring. The key question mark here should be Argentina, where the third year of La Nina could damage both corn and soybeans.
VHI readings to start 2023 are at the lowest levels on record for both crops in Argentina, where the Buenos Aires Grain Exchange said only 8% of soybeans and 13% of corn were in good or excellent condition. Even allowing for error, yields could be down 20%, with blistering temperatures returning after a brief respite of rain.
Demand debate
Smaller Argentine crops could boost demand for U.S exports, factoring into the Jan. 12 report that speaks to the future: projected Aug. 31, 2023 ending stocks complied in the World Agricultural Supply And Demand Estimates.
The government’s forecasts for carryout will reflect both 2022 production and first quarter usage, adjusted with predictions for the rest of the marketing year.
Unless the Dec. 1 corn stocks data indicates a surge in feed usage, total demand could suffer from flagging export sales. USDA slashed its forecast for exports in December by 75 million bushels to 2.075 billion, and more cuts could be on the horizon. Total sales and shipments of corn through the end of 2022 were 15% below the five-year average and could be even lower unless business picks up. Corn usage to make ethanol appears to be more than 5% lower so far, and negative margins and fears of inflation and recession could keep the final total limited.
The demand outlook for soybeans is mixed. First quarter crush was slightly higher than the previous year, but the increase was not as great as forecast by USDA. Exports are down from a year ago, though perhaps the decline isn’t as great as USDA last forecast. That could leave changes in ending stocks dependent on residual usage or final 2022 production.
The wild card, as usual, is China. Fallout from COVID and shipping disruptions kept China’s soybean imports subdued in the first quarter, but purchases from the U.S. have picked up some. With Brazil likely sitting on another big crop, the second half of the marketing year could be a challenge, limiting further reductions in carryout projections.
Chart watch
Price charts could be the best barometer of the reports’ impacts headed forward. Nearby corn held to a 60-cent range since harvest. A break by March futures below $6.35 would be bearish to old crop, while move above $7 likely would be needed to really get the bulls charging.
Nearby soybeans, by contrast, rallied $1.75 after harvest, posting a steady uptrend. That bodes well for rallies in 2023 according to seasonal charts.
New crop futures reflect similar trends. December 2023 corn broke below $6 to begin the new year, while November 2023 soybeans tried to cement a move above $14. Barring big changes in weather or geopolitical/economic developments around the world, traders may not have a lot of old crop news to trade, turning more of the debate in the market to spring planting intentions. With fertilizer prices continuing to soften, expect to hear more bearish corn talk about farmers boosting acreage plans in the end of March reports, the next big data dump for USDA.
Knorr writes from Chicago, Ill. Email him at [email protected]
The opinions of the author are not necessarily those of Farm Futures or Farm Progress.
About the Author(s)
You May Also Like


