USDA’s long-awaited Aug. 12 production report juggled a lot of the numbers, but didn’t reveal much in the way of surprises. Corn yields of 175.4 bushels per acre were close to average guess of 175.9 circulating in the trade. Soybeans missed the mark a little more, coming in at 51.9 bpa, compared to the trade’s prediction of 51.1 bpa.
Acreage also changed slightly after a survey of late-planted fields in some states.
But all in all, the agency’s first real look at 2022 production didn’t provide a lot of major headlines.
Now begins the time-honored debate of second-guessing USDA’s estimates. The government’s next production update won’t come for another month, giving market participants plenty of time to spin the results. But history suggests the August numbers may be a good guide to expectations down the road.
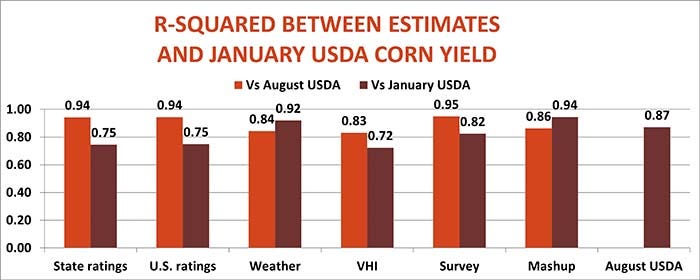
Over the past 15 years these August yields proved more reliable than most other forecasting methods, using R-squared, a statistical tool for measuring correlation between two sets of data. In this case that’s USDA estimates and different methods of forecasting yields. The higher the r-squared, the stronger the connection, expressed as the percentage of variance in one variable explained by the variance in the other.
While the accuracy of USDA’s first print does erode by the time the last monthly estimates are made in January, most other ways I use this month to predict yields degrade even more. The agency’s August estimates explained more than 86% of the variance with final January corn and soybean yields. Moreover, the accuracy of the best ways for predicting USDA’s August numbers fizzle out by the time the last estimates are published in January.
Five alternatives to USDA
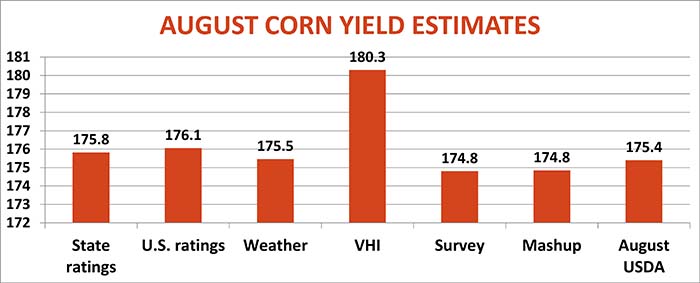
I estimate yields five ways, a process that usually starts early in June when weekly Crop Progress condition reports begin. These nationwide ratings weight 18 individual state by the average acres planted there over the three previous years. One of my August yield estimates compares national ratings around the same time USDA surveys farmers to final yields for the crop year.
Another method weights the individual states differently, according to the latest estimate for current year’s harvested acres. Differences between the two methods usually are not large unless significant acreage shifts occur.
A third method looks at weather, adapting a model USDA economists developed after the 2012 drought. The corn version uses data from eight key states, including May 15 planting progress, June stress on fields, and July rainfall and temperatures. Soybean predictions ditch planting progress and compare weather in both July and August along with June stress in seven large producing states.
I also estimate yields using crop-specific Vegetation Health Index data on both a national basis and in key producing states, weighted for harvested acres. Differences between the two estimates are a little larger than with Crop Progress models, but both show about the same accuracy overall.
USDA surveys farmers for its August production report, then begins actual field samples in September. So, for this first batch of early estimates I also rely on the Farm Futures grower survey, which began surveying for August yields back in 2007.
Then, I mashup all these factors into a multiple regression analysis.
All the methods produce results that are statistically significant. That is, the connection between the method and USDA’s estimates appear to be more than the result of mere chance. But there are differences, depending on the crop and the method.
Watch weather for corn
With the August USDA corn yield at 175.4 bpa, the weather method came closest, missing by just one-tend of a bushel after updated temperature and precipitation data was released for July. Over the past 15 years, crop ratings and the Farm Futures survey proved the most reliable predictors of the August USDA report for corn. But the August winners proved less accurate in predicting what the government would report in January. The VHI also declined as an indicator, though all these methods meet the test of statistical significance.
Two methods improved their R-squared performance from August to January, including the weather model. But the multiple regression mashup incorporating all five tools was the most accurate, explaining 94% of the variance with January, even better than August’s USDA report, which was behind weather at 87%.
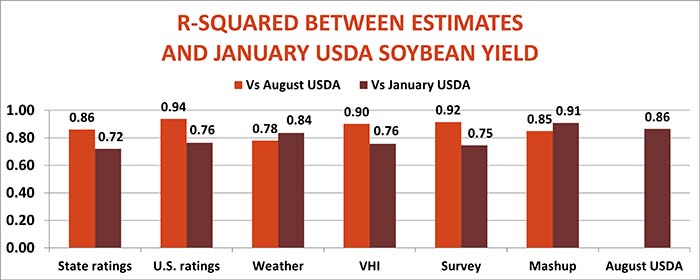
Soybeans: Stay tuned
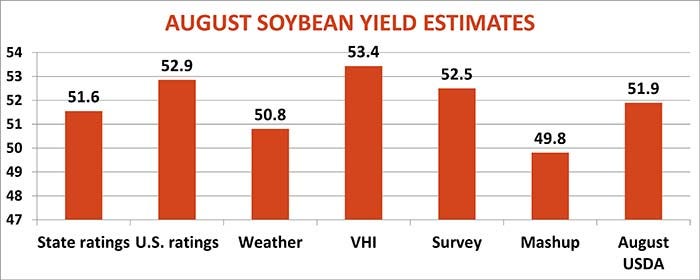
Conditions in the last half of August should seal the fate of the soybean crop, for better or worse, which could explain the larger difference in estimates compared to corn. USDA put 2022 yields at 51.9 bpa in its Aug. 12 report, which made the state Crop Progress model closest at 51.6 bpa.
Since 2007, the best performer for predicting August USDA numbers was national Crop Progress ratings, which explained 94% of the variance with the government’s forecast.
As with corn, the winners in August faded by January, with weather and the mashup of factors improving their accuracy with the final government yield forecast for the crop. And, the same as corn, the mashup method proved even more reliable than USDA’s August forecast.
So what do you do with this information? Based on trends since 2007, the August USDA forecasts suggest January yields of 173.8 for corn and 51.5 bpa for soybeans. The multiple regression method translates into yields of 175 bpa and 49.5 bpa. So, lower yields could be coming, eventually.
Of course, no forecasting method is perfect. As with any model, results depend on the accuracy of data, and that can present problems trying to do near real-time analysis.
Vegetation indexes are frequently revised, and there are some indication recent data may also undergo a scalpel. Indeed, one possible explanation for this year’s large estimates produced with VHI readings may be due to a surge in indexes at the end of July in Illinois, Indiana, Ohio and Minnesota, though overall conditions declined last week.
Weather data can be updated as errors and missing pieces are found. And, of course, August average weather readings have yet to be collected, which is crucial for soybeans. Temperatures in key soybean states averaged more than two degrees above average in the first 11 days of August, though rainfall, outside of bone-dry Nebraska was above normal. The latest Drought Monitor reported 24% of the crop in a drought-affected area, down from 28% the previous week and below the year-ago level of 32%.
Forecasts for the next two weeks show soil moisture declining outside of Missouri, central and southern Illinois and parts of the Ohio River Valley. But overall the outlook indicates no real extreme conditions.
Finally, remember that while these are educated guesses, they’re still guesses. Even USDA doesn’t count every bushel harvested, or even close to it. That’s one reason why the agency can revise its January estimates the following September, when inventory and usage data are known.
Even then, the ink isn’t dried until the next Census of Agriculture is published every five years. With USDA’s August forecasts, it’s never over until it’s over.
Knorr writes from Chicago, Ill. Email him at [email protected]
The opinions of the author are not necessarily those of Farm Futures or Farm Progress.
About the Author(s)
You May Also Like


