Post-mortems aren’t only for crime scene shows on TV. Before signing off on your marketing plan for 2023, make sure you know what worked – and didn’t work – for your sales strategy in 2022.
While the current marketing year won’t be over until Aug. 31, averages so far look solidly profitable for corn and soybeans. But a deep dive through gains and losses can help pinpoint true risks and rewards.
Indeed, 2022 was anything but a one-size, fits-all year. Farm Futures long-term study of preharvest selling strategies showed results varied across the growing region. And what worked for soybeans didn’t necessarily work for corn. Key differences affected hedging alternatives, including basis, yields and the timing of harvests and sales.
The Farm Futures study traces strategy performance dating all the way back to 1985, when options trading resumed after a decades-long ban. Strategies include average price contracts, and sales with futures/hedge-to-arrives and options made during key seasonal windows in the spring and early summer. Results are benchmarked to harvest cash receipts at 11 locations for corn and nine for soybeans.
The study is hypothetical and not the result of actual trades, but it uses posted cash prices and official futures and options settlements, with positions liquidated when harvest reached the halfway point in each state according to USDA Crop Progress reports. Hedges covering 100% of expected production were timed to the second week of April, third week of May and fourth week of June, which historically align with seasonal strength. Average sales contract periods ran from January or March through August before harvest.
Winners and losers
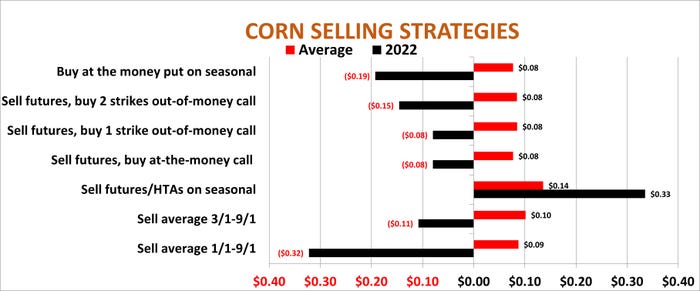
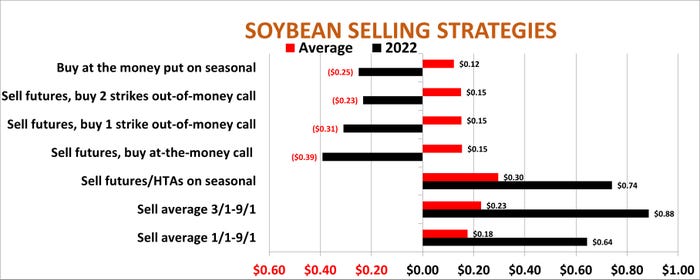
Straight futures/HTAs performed about the same for both corn and soybeans. When averaged across the three selling windows and locations, each earned around 1.5 times the long-term average.
For soybeans, that amounted to 74 cents a bushel, with corn netting 33 cents after results were weighted by harvested yields. Corn sales with futures/HTAs historically earn the most on average, posting gains 71% of the time.
Soybean hedges also tend to be the most profitable, posting gains in 68% of the 38 years studied. But the seasonal soybean sales weren’t the most profitable for the crop. That honor fell to the average price contracts from the March through August window, which netted 88 cents a bushel.
Compared to December 2022 corn, the rally in November 2022 soybean futures was sharper over the winter, lasted longer in the growing season and bounced back more quickly after a July slump. The January-August average soybean contract also posted gains, but both systems for corn recorded losses.
Average price contracts are one way of attempting to iron out risk from futures market extremes. Options are another tool that can control losses in years when prices keep rising sharply after sales are made.
The Farm Futures study looks at two methods: purchasing put options, and creating a so-called synthetic put that combines a long call option with a futures/HTA sale. Call purchases are made during times of seasonal weakness in futures before sales are made in an attempt to lower the price of the option. Three strike prices for calls are considered: at-the-money and one- and two-strikes out of the money.
Whatever the options tool or pricing window, all on average lost money for both corn and soybeans in 2022 due to the initial cost of the position. High futures prices elevated these premiums, which must be paid upfront, creating headwinds despite the overall decline of prices into harvest.
Whys and wherefores
Closer examination of results showed hedging profits from futures positions varied depending on expected yields that were sold and when crops were harvested and positions liquidated.
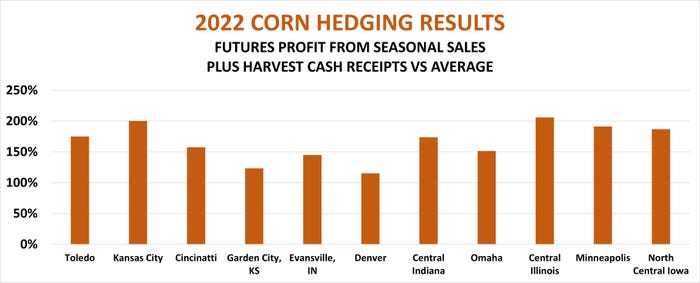
Areas with an early soybean harvest and good normal yields produced more futures/HTA hedging profit per acre because positions were liquidated when November futures bottomed in the first week of October. Two weeks later, futures were higher, hurting hedge profits in states like Missouri, which produced half the gains of Nebraska. A late harvest in Colorado also hurt corn hedgers, who netted the least per acre of any of the 11 locations studied.
But hedging profits are only part of the case when examining your marketing post-mortem. Results from preharvest sales combined with cash values at harvest are the true result of a marketing strategy, and sales off the combine were affected by boom or bust yields and large variations in basis.
A double whammy of bad news hurt results along the Ohio River for both corn and soybeans. Barge freight rates from Cincinnati and the Lower Ohio to the Gulf reached an all-time high in October as low water on the lower Mississippi River restricted the number of barges per tow.
Better than normal corn yields and a later harvest meant too much supply chasing too few barges at a time when export shippers traditionally want soybeans to move. Corn volumes plummeted while soybean shipments on the river were rising during the October harvest. Corn basis in Cincinnati was 53 cents weaker than average as a result.
Yields were even better in Illinois, but Central Illinois benchmark basis was 8 cents stronger than average thanks to rail and ethanol demand. Harvest revenues of $1,451 an acre were more than two times average, the best performance of any location studied.
Corn farms on the parched Southwest Plains fared the worst. Though basis was $1 or more stronger than average due to short supply, poor yields produced revenues from cash sales that didn’t match the rest of the country.
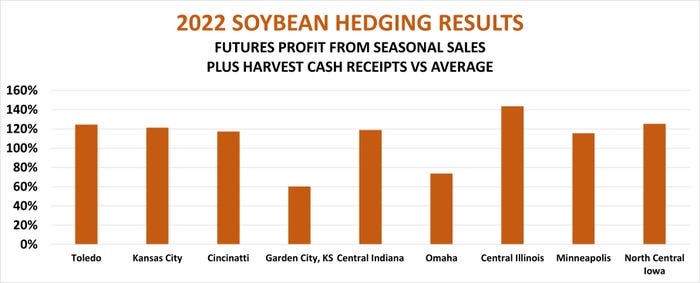
Disappointing yields also made Southwest Kansas the lowest performing soybean location. Central Illinois again led the pack, with better than average basis and yields producing harvest revenues nearly one-and-a-half times the long-term average.
Central Illinois also led the pack when hedge profits and cash sales were combined, producing 52% more compared to average than earned on the Southwest Plains for soybeans and 42% more for corn.
All these factors may help explain some of the results from a post-mortem on your own farm’s marketing efforts and shed light on modifications for 2023. And remember, losing hedges doesn't mean failure – that’s the nature of managing risk with preharvest sales. The goal is to make a profit. Thanks to good prices, most producers are likely to report just that on their Schedule F.
View complete results of the study, organized by years and location:
Central Illinois: Corn | Soybeans
Central Indiana: Corn | Soybeans
Denver: Corn
Evansville: Corn
Garden City, Kansas: Corn | Soybeans
North Central Iowa: Corn | Soybeans
Omaha: Corn
Knorr writes from Chicago, Ill. Email him at [email protected].
The opinions of the author are not necessarily those of Farm Futures or Farm Progress.
About the Author(s)
You May Also Like


