Farmers are still harvesting this year’s corn and soybean crops as November begins. But the market is already starting its pivot to the fields growers are planning for next spring. The “battle for acres” will face its first real data dump this week when USDA releases initial forecasts for 2022 plantings and prices.
These estimates, based on economic modelling, not farmer surveys, are part of the agency’s budgeting process for projecting farm program expenses over the next decade. They’ll be updated in February before what’s likely to be a highly anticipated Prospective Plantings survey put out at the end of March.
Will input prices cause a crop shift?
Farm Futures’ August tally of producers showed them ready to go for 94.3 million acres of corn and 90.8 million acres of soybeans, up 1.1% and 4.1% respectively from 2021. Conventional wisdom, however, leans towards a shift from corn to soybeans, in part due to soaring nitrogen costs that continued to jump higher again last week.
November contracts for ammonia at the Gulf settled near $750 a short ton, up $145 from last month and the highest since that market peaked at $844 in October 2008. Nitrogen costs could continue to escalate after India failed to attract much attention with its latest urea tender, leaving the big importer short and likely forced back into the market soon.
Average retail ammonia prices are up around 60% since USDA published its first estimate of 2022 production costs in June, with most updated offers running $1,200 to $1,300 or more. That’s taken the average cost for growing corn to $717 an acre, or around $4.03 a bushel for 178-bush-per-acre yields. Soybean costs per acre by contrast are running around $503, or $9.67 per bushel for 52-bpa yields.
Those expenses reflect lower costs for machinery depreciation forecasted by USDA. Government economists include the opportunity cost associated with growers’ investment in equipment, which is not factored in by most farmers’ accounting methods.
Still, even with higher costs for fertilizer, fuel and other inflation-sensitive values, corn looks better than soybeans, thanks to an impressive rally this fall. December 2022 corn futures are up around 50 cents a bushel since the Farm Futures survey was conducted prior to USDA’s August report, closing at $5.50 last week. November 2022 soybeans, by contrast, are essentially flat to a little lower, closing at $12.405 last week.
Corn vs. soybeans
The ratio between the two crops is starting to tilt in favor of corn, though not dramatically so. Further complicating farmer planting decisions is not only what prices will do, but whether enough nitrogen will be available at all in some places due to supply chain problems.
To provide some perspective, I put together a sensitivity analysis for both crops focusing on three of the uncertainties growers confront. In addition to varying harvest prices and yields, these “what if” data tables look at the risk of pricing today or doing nothing depending on what happens to crop insurance guarantees and production costs.
These are averages for costs, basis and yields, and include the assumption most growers will opt for Agriculture Risk Coverage at the county level for both crops in 2022 to provide a backstop, along with Revenue Protection crop insurance at the 80% level.
Corn scenarios
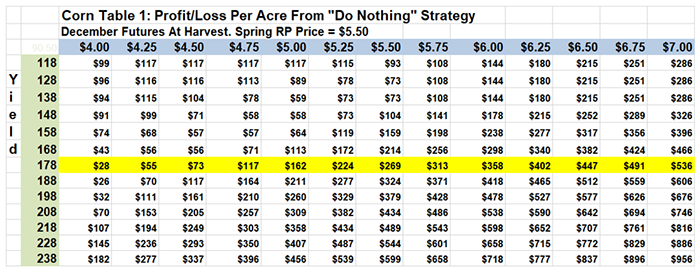
Table 1 for corn shows the profit/loss per acre from doing nothing and just accepting the harvest price. The yellow-barred line lists results from average yields of 178 bushels per acre. Playing the waiting game looks good – there’s no red ink on this income statement – but it comes with a very big “if.” Outcomes assume the spring price for crop insurance comes in at the current price of $5.50, providing a strong backstop on revenues from RP.
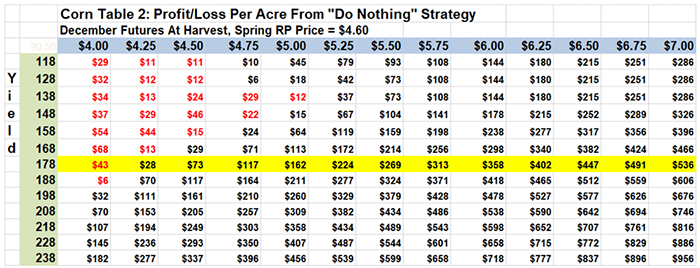
Table 2 shows why that crop insurance question is so important. If December futures tumble back to support at spring and summer lows around $4.60, losses start to appear on the data table when yields falter and harvest prices fall as well. While there’s plenty of upside if the market rallies, losses of $50 an acre or more are possible.
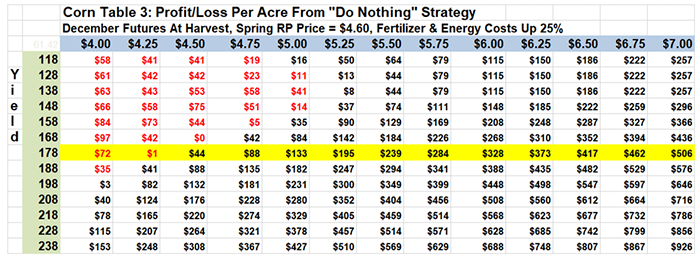
Table 3 shows how losses accelerate if fertilizer and energy costs continue to rise, increasing another 25% from current levels. While most of the table outcomes turn a profit, potential losses from a worst-case scenario approach $100 an acre.
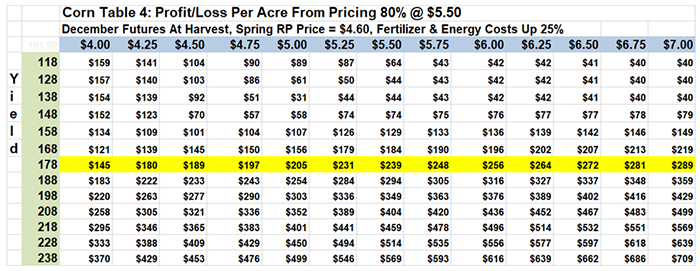
One solution for the risk-averse is to hedge at current price levels. Table 4 shows results for bushels sold at $5.50 December up to the crop insurance coverage. Even with higher costs, lower RP protection and yield losses of a third or more, sales would still be profitable.
Soybean scenarios
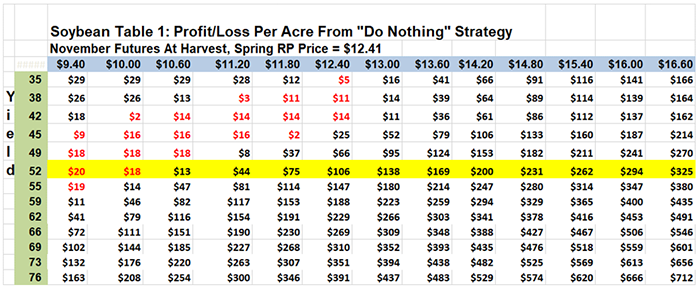
Soybean profit/loss tables show potential for gains, but suggest farmers may think twice about ditching corn. All four scenarios show soybeans lagging, assuming the direction of prices and yields is the same for both crops.
For beans, the assumed “normal” yield would be a record 52 bpa, as indicated by the yellow-barred line. Assuming the current November futures prices holds for February, when RP coverage is set, that would beef up crop insurance protection, helping keep losses to $20 or less if prices and yields fall in Table 1.
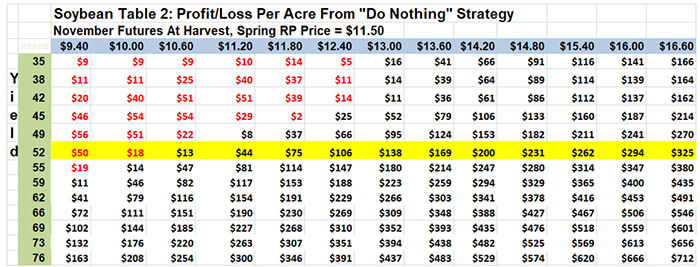
Table 2 illustrates the importance of that RP coverage. If the spring price for RP falls to $11.50, near the summer low, potential losses per acre from doing nothing could top $50. Steady prices and normal yields would return $106 an acre, compared to $269 for corn under a similar scenario.
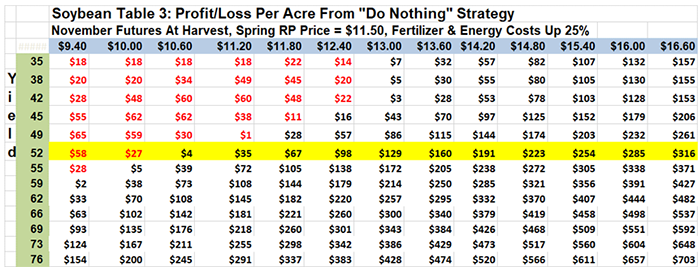
Rising fuel and fertilizer costs only increase the risk from waiting, as shown in Table 3. Soybean margins aren’t as exposed to the crazy fertilizer market as corn, but phosphates and potash are still at the highest levels in more than a decade.
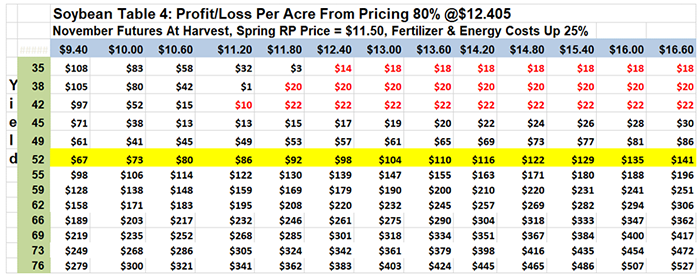
Hedging at current price levels eases some of the potential risk from higher costs and lower crop insurance protection. Table 4 shows how those sales stay in the black regardless of harvest prices as long as yields don’t fall more than 8 bushels below average. Even then, downside risk is limited to $22 an acre.
2022 acreage forecasts
In a normal year, traders might not pay all that much attention to USDA’s 2022 forecasts. But lack of information as 2021 ends, coupled with relative tight old crop stocks, could give this week’s estimates more heft than usual. USDA updates 2021 supply and demand estimates Nov. 9, but typically doesn’t make big adjustments in December, creating a data vacuum until big reports due in January, including final production numbers, Dec. 1 Grain Stocks and winter wheat seedings.
That makes 2022 acreage an attractive metric to trade for speculator and big investors wondering where to put their money.
Knorr writes from Chicago, Ill. Email him at [email protected]
The opinions of the author are not necessarily those of Farm Futures or Farm Progress.
About the Author(s)
You May Also Like


