Subscribe to receive top agriculture news
Be informed daily with these free e-newsletters

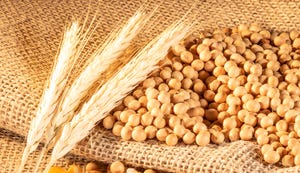
Hurricanes have taken a tole on soybean exports. What does the remainder of the year have in store?

Soybean exports for the 2021-22 season did not get off to the best of starts with Hurricane Ida ravaging the Louisiana Gulf Coast and causing significant damage to both humans as well as residential and commercial properties in early September.
Several export facilities were closed for a period of time with Cargill’s Reserve elevator perhaps incurring the worst damage. September is of course, a critical month for the ramping up of U.S. corn/soybean exports and re-building the pipeline. Various reports suggested that as much as 45-50% of the Gulf’s export capacity was impaired for the month.
Export data from the USDA’s Agricultural Marketing Service reflects the hurricane’s impact. Mississippi River exports of corn, soybeans and wheat totaled over 210 million bushels last September. This year that number plunged to less than 85 mbu with soybeans suffering the largest decline, down 75% to just 37 million.
For overseas consumers of soybeans, the good news was that the U.S.’s most formidable competitor, Brazil, began September with 30% more soybeans on hand, or about 300 million bushels. And, buyers have been able to source Brazilian soybeans as a partial replacement.
That being said, what does the rest of the year look like for U.S. soybean exports? Keep in mind the USDA is forecasting a 170 mbu decline for the year as a whole to 2.090 billion. Last year, September-February exports were close to 1.975 billion bushels. As the above suggests, South American suppliers should displace 300 mbu of U.S. soybeans. AND, this is just during the 1st half of the year! So, last year’s 2.260 billion bushel export total would seem to be headed to 1.96 billion right off the bat.
How does the demand side of the equation look? Not overly optimistic. Sales through Sept. 30 of 931 mbu trail the same date last year by 590 mbu, or 38%. The destination which really jumps out is of course, China. Its purchases are down 355 million and sales to Unknown are 139 million fewer at 255. Finally, commitments to all other markets are off to a slow start as well with the 219 total to these destinations lagging 64 mbu, or 23% behind the 2020-21 total.
The two charts below pertain to China’s monumental role in world soybean trade, accounting for about 60% of imports. The first chart, “China: YTD SB Sales & Annual Exports,” plots year-to-date U.S. soybean sales to China on the horizontal axis as of late September, and the U.S.’s annual export total to China on the vertical axis. There is a reasonably good fit but with two exceptions: 2015/16 and 2016/17. The former saw a near-3 million metric ton year-to-year reduction in Brazil exports due to a smaller crop while China’s imports in 16/17 jumped over 10 MMT (375 mbu) in response to annual growth rates in crush/soybean meal demand of 8% or more. Because of Brazil’s production shortfall in 15/16, China had to buy more than its “usual” amount of soybeans from the U.S. and its strong import total in 16/17 was in part due to 3 consecutive years of strong meal demand. Note that U.S. exports to China in 2020-21 were about 1.3 billion; the graph is forecasting 925 this year, or a decline of 375 million, double the reduction forecast by the USDA to ALL destinations.
The second chart below gives a 4-week moving average of China’s crush along with prior years, beginning January 1. Note the orange line (this year, 2021) versus the dark shaded area for last year (2020). As the chart insert says, the latest 4-week average is running about 14% below last year and this should suggest “LESS” need for imported soybeans as meal consumption slows. Also, China is purportedly starting off 21-22 with 6 MMT MORE domestic soybean supplies (due mostly to higher stocks) than a year ago so this adds to the cushion for bridging the gap between this fall’s Brazilian supplies and the latter’s new crop harvest when exports should really take off in March. Adding further creditability to the argument China will need fewer U.S. soybeans this year.


One last point, again from the South American supply side. The USDA’s latest forecast for Spring 2022’s production from Argentina, Brazil and Paraguay is a record 7.6 billion bushels, a not-so-small 500 mbu increase from last year. What might this mean for the U.S. 2022-23 crop year?
The final graph gives the year-to-year change in South American production on the horizontal axis, and the following year’s U.S. average farm price on the vertical. This year’s projected 13.6 MMT increase falls within a range outlined by the red oblong shape. Note that the 10-20 K range has multiple years in which next year’s average price was $10 or less following large gains in South American production.
We used the USDA’s February baseline projection of $9.90 for 2022-23 to illustrate the point and this may be overstating the downside potential. Needless to say, South American weather over the winter months will likely be the most important price factor; producers would be well advised to discuss the appropriate options strategy with their risk managers.

Contact Advance Trading at (800) 664-2321 or go to www.advance-trading.com.
Information provided may include opinions of the author and is subject to the following disclosures:
The risk of trading futures and options can be substantial. All information, publications, and material used and distributed by Advance Trading Inc. shall be construed as a solicitation. ATI does not maintain an independent research department as defined in CFTC Regulation 1.71. Information obtained from third-party sources is believed to be reliable, but its accuracy is not guaranteed by Advance Trading Inc. Past performance is not necessarily indicative of future results.
The opinions of the author are not necessarily those of Farm Futures or Farm Progress.
You May Also Like
Enter a zip code to see the weather conditions for a different location.