First impressions can have a lasting impact long after that initial glance. Still, when evaluating prospects for corn and soybean yields this year, remember that looks can be deceiving.
USDA publishes its first survey-based estimate of yields Aug. 12. Until now, production prospects have been mostly conjecture, so the government’s numbers will finally provide some harder evidence of what farmers have out in the field.
But history advises against falling in love with these forecasts. By the time the last production figures come out in January, they could look completely different.
My own “guess” is for a corn yield of 176.7 bushels per acre, with soybeans coming in at 51.3 bpa. Before digging into the mechanics of producing these estimates, it’s worth noting what happened a year ago. The models I use for predictions spit out a range from 178.4 to 184 bpa in August 2020, and USDA came in at 181.8.
Five months later the yield was put at just 172 bpa. Nearby corn hasn’t traded below $5 since.
Soybean crop got smaller
USDA’s soybean estimate a year ago was also bearish, a mammoth 53.3 bpa. My models before the report ranged between 50.4 and 55.1 bpa, and USDA’s January yield fell all the way to 50.2.
The same, or maybe even more uncertainty exists this year as an unusual growing season heads down the home stretch.
Why the doubts? In addition to the pact of drought in the northwest Corn Belt, August weather could be important again. A year ago early optimism from USDA was undercut by the beginnings of the turn drier that developed into this year’s full-blown disaster for some growers.
I use a variety of techniques for my yield estimates. Most years one of these has the “right” number, though that wasn’t the case for corn last year.
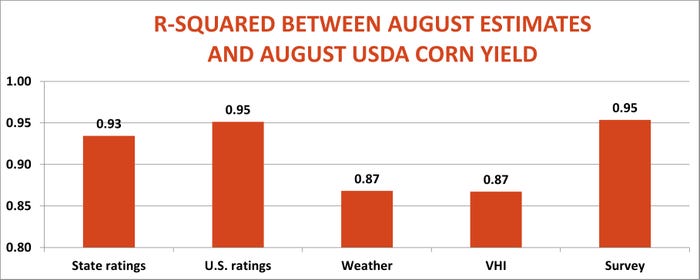
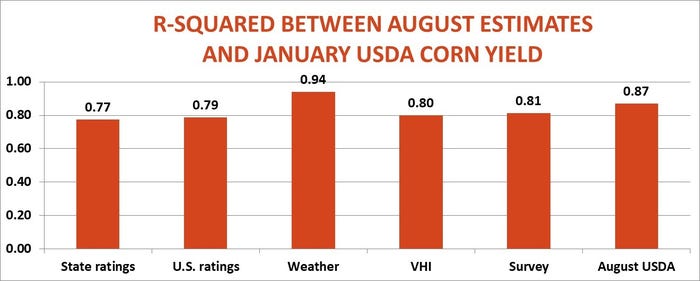
For corn the most accurate method for since 2006 is Farm Futures own survey of farmers, which won’t be out until later this week. Running a close second is the forecast based on weekly nationwide crop ratings, with a state-by-state analysis close behind. Estimates made from weather and the Vegetation Health Index show less accuracy, but all these crystal balls account for more than 85% of the variance with USDA’s actual August number – the so-called R-squared.
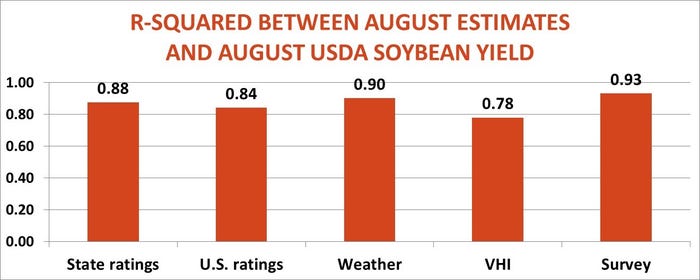
Farm Futures survey is also the most accurate for predicting USDA’s August soybean yield, followed by weather, crop ratings and the VHI.
Yields look “normal”
So what do the models say for 2021? At the low end of the range is the 170.4 bpa produced by the VHI model. Crop ratings are a little stronger, with 172.3 and 174.4 bpa put out by the state and national rankings respectively.
At the other end of the spectrum is the weather model, which comes in at a whopping 184.9 bpa. But that figure illustrates some of the difficulty in making projections so early. It’s based on preliminary July average temperatures and rainfall in key corn states, using gauge readings that typically change by the time the final data is cleaned and published. Using rainfall estimates made in part by satellite maps would cut the yield down to 179.1 bpa.
Those crop progress ratings can be fine-tuned, too. My ratings models compare yields to the final ratings put out in the fall. Making a forecast using ratings historically from the first week of August raises the yield estimate to 179 bpa.
Average all these projections together and the result is my overall estimate of 176.7 bpa, less than a bushel from what’s considered a statistically “normal” yield.
USDA results vary
Soybean estimates face even more potential for surprises because the crop is made in August. I plugged in the latest forecasts for the next month into my estimate, which came in at 51.3 bpa using preliminary July weather data. Relying on July satellite rainfall trimmed that slightly to 51.1.
Unlike the wide range of corn estimates, the variation in soybeans is less. The VHI model came up with the lowest reading, 50.6 bpa, with state crop ratings at 51 and national conditions at 52.1. Using historical ratings in the first week of August trimmed that to 51.9 bpa, with the average of all these results at 51.3. That’s very close to the estimate of a “normal” crop using a 20-year trend yield.
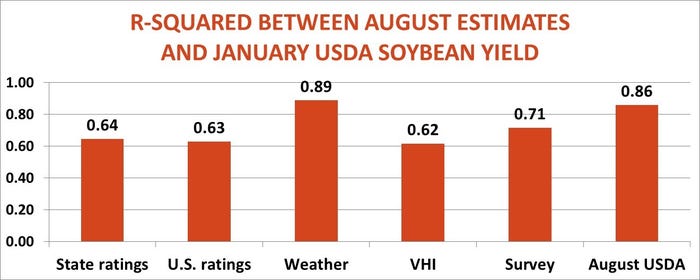
When all is said and done in January, USDA’s August estimate holds up fairly well for both corn and soybeans. Only the weather models are more accurate. But as last year showed, the government number can also be off, sometimes by a lot.
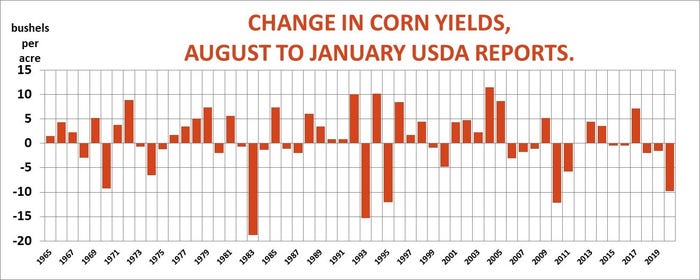
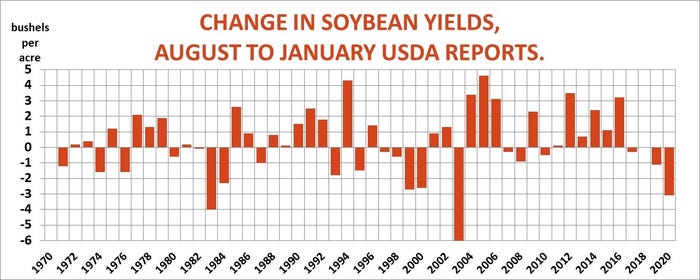
Indeed, it’s hard to predict how final January production estimates for 2021 will turn out. Since 1965 the corn yield dropped from August 25 years, got bigger 30 times and stayed the same once. Soybean yields fell 23 times, rose 31 times and stayed the same twice. None of those differences are big enough to be statistically significant, meaning there’s no clear trend.
That suggests debate over the size of 2021 crops is far from over. History suggests it’s only beginning.
Knorr writes from Chicago, Ill. Email him at [email protected]
The opinions of the author are not necessarily those of Farm Futures or Farm Progress.
Read more about:
YieldsAbout the Author(s)
You May Also Like


