

Subscribe to receive top agriculture news
Be informed daily with these free e-newsletters

The United States faces challenges related to a relatively strong U.S. dollar, which tends to keep U.S. beef prices relatively high in foreign currency terms.
January 20, 2023

Exports will be a key driver for cattle and beef markets in 2023. How export demand holds up will be influenced by what happens in currency markets. Beef export data continue to show overall growth, but with a high level of economic uncertainty worldwide, headwinds remain strong.
Data for U.S. beef exports are reported in metric tons of product weight by the U.S. Department of Commerce. Quantities are often converted from metric tons to pounds. These quantity data is also often converted from a product-weight basis to a carcass-weight-equivalent (CWE) basis. Data are converted to a CWE basis to allow “apples-to-apples” comparisons to beef production data, which are reported in CWE. Beef exports accounted for 12.2% of total annual production in 2021. The export share was up slightly in 2022.
USDA’s Economic Research Service calculates and publishes beef trade numbers on a CWE basis. The latest official export numbers available are for November. Data are published about five weeks after the close of a month.
November trade data showed monthly U.S. beef import levels were the lowest in nearly two years, while exports saw only the second year-over-year decline in 2022. November beef exports were 277 million pounds, down 6.1% from November 2021. Lower shipments were seen to most major destinations, with China down 10.7% from a year earlier, Japan down 10.1%, Mexico down 5.4%, and South Korea down 3%. Exports to Canada posted a 7.9% year-over-year increase.
January to November 2022 export volume was 3.27 billion pounds, up 4% from the record pace of 2021. Year-to-date exports to Japan, the leading volume market for U.S. beef, were down 1.7% from the same period last year. January to November export volume to South Korea was up 2.1% and likely to break the 2021 volume record when December data are available. January to November beef exports to China were up 22.3% and have already broken the annual 2021 record. Through November, exports to Mexico and Canada were 11.6% below and 1.6% above last year’s pace, respectively. Beef exports to the Philippines, Singapore and Cambodia already set annual volume records, and shipments to Thailand are on a record pace. Export volume to Taiwan through November is also on a record pace and well-positioned to top the 2020 record.
U.S. beef imports were 241 million pounds in November, down 18.8% from November 2021, marking the lowest monthly import level since February 2021 (198.4 million pounds). Lower imports were due to a 3.6% decrease in shipments from Mexico, 20.9% decline from Australia, 32.1% decline from New Zealand and 62.6% decline from Brazil, which more than offset a 3.2% increase in shipments from Canada. Through November, imports were up 2.3% year-over-year, with Canada up 1.1%, Mexico up 10.7%, and Brazil up 42%. Year-to-date beef imports from Australia and New Zealand are down 3.4% and 22.9%, respectively.
The World Agricultural Supply and Demand Estimates, prepared and released by the World Agricultural Outlook Board, have beef exports declining by about 13% in 2023 compared to 2022, and imports declining about 1% ― with their forecasts reflecting the supply realities here in the United States and abroad.
A weaker U.S. dollar is needed to offset some of the expected increase in export prices. Any continuing strength in the U.S. dollar would not bode well for exports. A stronger U.S. dollar means international buyers have to pay more of their own currency to buy U.S. beef. A strong U.S. dollar also tends to support U.S. beef imports as it effectively lowers the price of goods in other markets.
The exchange rate between two currencies specifies how much one currency is worth in terms of the other. There are two ways to express exchange rates. One is the number of units of foreign currency necessary to purchase one unit of domestic currency. The other way is the number of units of domestic currency necessary to purchase one unit of foreign currency. For example, let’s take the case of the United States (USD or US$) and Canada (CAD or $C). An exchange rate of 0.7374 means US$0.7374 would be needed to purchase one CAD. The 0.7374 rate could also be expressed as requiring C$1.3561 to buy one USD. In other words, 0.7374 is really 1 divided by 1.3561, and 1.3561 is really 1 divided by 0.7374.
The U.S. Dollar Index is used to measure the value of the dollar against a basket of foreign currencies. The six currencies included in the U.S. Dollar Index are the Euro, Swiss franc, Japanese yen, Canadian dollar, British pound, and Swedish krona. Comparing the average of daily U.S. Dollar Index values in 2022 to 2021, the U.S. dollar appreciated 12.4% in 2022. It hit a two-decade high in September and remained at elevated levels through early November, before retreating some to end the year.
A stronger U.S. dollar implies ongoing uncertainty in world financial markets and the flight to the perceived safety of U.S. bonds. In the short term, the exchange rate is determined by the flow of a currency between two countries. Currency flow is affected by interest rates, trade balance, investors’ confidence, and issues or expectations in one country relative to another country. A global recession would hit emerging markets particularly hard, and this has been an area of growth for U.S. beef exports in recent years.
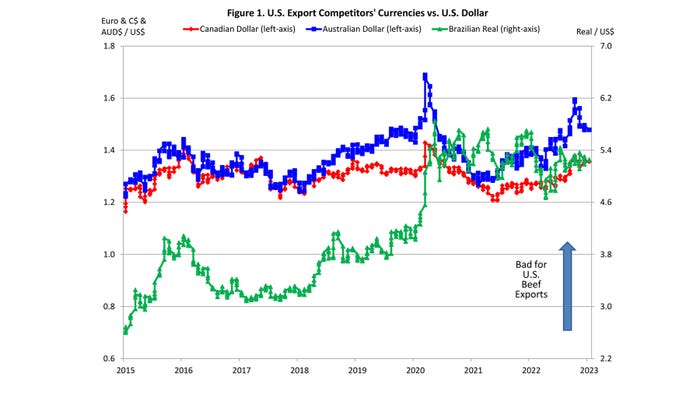
While the U.S. Dollar Index is a barometer of the dollar’s collective worldwide value, attention always needs to be paid to individual currencies. Several currencies that are very important to the competitive position of the U.S. are not included in the U.S. Dollar Index. Among these are the Mexican peso, South Korean won, Brazilian real and Australian dollar.
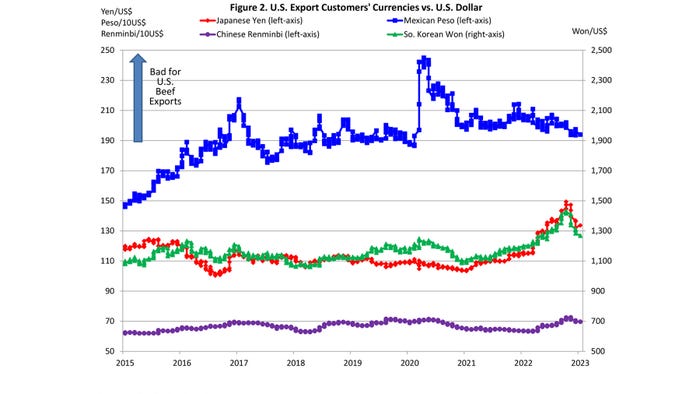
Figure 1 shows the U.S. dollar versus the currencies of countries that are major beef export competitors in the global marketplace with the United States. Compared to the Australian dollar, the U.S. dollar was about 8% more expensive in 2022 than in 2021, while compared to the Brazilian real, the U.S. dollar was about 4% less expensive in 2022 than in 2021. That, is the dollar got weaker relative to the Brazilian real (i.e., takes less Brazilian reals to buy one U.S. dollar) which is good for export competitiveness while the U.S. dollar got stronger relative to the Australian dollar (i.e., takes more Australian dollars to buy one U.S. dollar) which is bad for export competitiveness.
Figure 2 shows the U.S. dollar versus the currencies of countries that are big buyers of beef. Compared to the Japanese yen, the U.S. dollar was about 20% more expensive in 2022 than in 2021. Similarly, the U.S. dollar gained about 13% on the South Korean won. The Mexican peso gained about 1% on the U.S. dollar in 2022 and is at its strongest relative level since 2019.
It is important to remember that the exchange rate is not the only factor in trade. Exchange rate shifts are translated into price changes for goods traded. Other events like drought and economic slowdowns can trigger indirect effects and affect trade levels. It’s also important to remember that for high-value products, like beef, quantity demanded can be less sensitive to price and currency fluctuations. A strong dollar will be a hurdle for beef exports in 2023 ― but as history has shown, it will not be a roadblock.
Schulz is an Extension ag economist with Iowa State University.
You May Also Like
Enter a zip code to see the weather conditions for a different location.


