Subscribe to receive top agriculture news
Be informed daily with these free e-newsletters

To a large extent, landowners and farmers are aware of the differences that exist in rents. Much of the difference in cash rents likely is due to desires of landowners and relationships between landowners and farmers. Quantifying these desires and relationships is difficult.
November 15, 2011
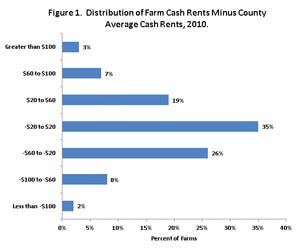
Published average cash rents mask the variability that exists in the farmland rental markets. To quantify variability, 2010 cash rents from individual farms in the Illinois Farm Business Farm Management (FBFM) are subtracted from average cash rents published by the National Agricultural Statistical Service (NASS). The resulting distribution is shown in Figure 1. In 2010, 35% of the farm cash rents are within $20 of the average county cash rent. 19% are between $20 and $60 per acre higher than the average county rent while 10% of the farm rents are $60 higher than the average county rent. 26% are between $20 and $60 lower than the average county rent and 10% are over $60 below the average county rent.
Overall, the average of cash rents from FBFM data are close to the averages from NASS. Over the entire state, FBFM rents average within $2 per acre of the NASS average county rents. This suggests that NASS data provides good indications of average county cash rents.
While NASS averages are accurate, average county rents mask the variability in rents within a county. Only 35% of farm cash rents are within $20 of the average rent. This leaves many cash rents that vary significantly from averages.
Furthermore, average cash rents from FBFM used in Figure 1 likely understate variability. Data used in constructing rents are average for a farm. Many farms have rented land from more than one landlord. Hence, a farm likely has some rents that are above the average and other rents that are below the average.
There are cash rents significantly above the average. For example, there are 3% of the farm rents that are $100 higher than the average county cash rent. In 2011, the average county cash rent in McLean County is $233 per acre (see FEFO 11-16). This would imply that that 3% of farm rents are above $333 per acre ($233 average plus $100). These above-average cash rents generally receive a great deal of public attention.
Given the nature of averages, there also must be rents below the average. As can be seen in Figure 1, 8% of the leases are between $60 and $100 lower than the average and 2% are $100 below the average.
Some of the difference in cash rents can be explained by differences in land productivities, with higher productivity leading to higher cash rents. Even given the productivity explanation, there is a large difference in rents across farms.
To a large extent, landowners and farmers are aware of the differences that exist in rents. Much of the difference in cash rents likely is due to desires of landowners and relationships between landowners and farmers. Quantifying these desires and relationships is difficult.
The distribution of cash rents points out difficulty in relying on average to cash rents. It also suggests that “high” cash rents should be taken as a limited indication of all rents within the rental market.
You May Also Like
Current Conditions for
48°F
Mostly Cloudy
Day 51º
Night 36º
Enter a zip code to see the weather conditions for a different location.


