Subscribe to receive top agriculture news
Be informed daily with these free e-newsletters

While yields were down in 2012, operator and farmland returns were positive in 2012. Operator and farmland returns are projected lower in 2013 than in 2012.
June 17, 2013
"Revenue and Costs for Corn, Soybeans, Wheat, and Double-Crop Soybeans" has been revised and is available here. Revisions from the last publication includes an update of 2012 results and projections for 2013.
Publication and 2012 results
 This publication gives results for northern, central, and southern Illinois. Per acre revenue and costs are shown for corn and soybeans in all regions. Wheat and double-crop soybean results also are reported for southern Illinois.
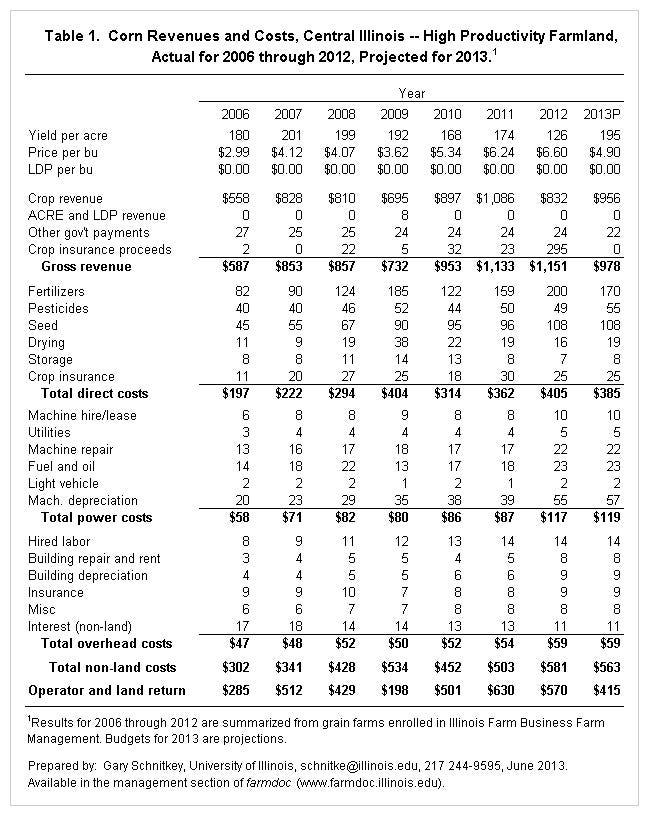
Table 1 shows one of the tables from the publication, showing revenue and costs for corn grown in central Illinois on high-productivity farmland. Results from 2006 through 2012 are summarized using data from farms enrolled in Illinois Farm Business Farm Management (FBFM). FBFM is a farm record-keeping and financial consulting service operated in Illinois. Farms enrolled in FBFM account for 25% of the acres farmed in Illinois. Also shown are projections for 2013, which modify 2012 items based on changes in commodity and input prices between 2012 and 2013.
Notable results for 2012 include:
Price per bushel in 2012 average $6.60 per bushel, up by $.36 from the 2011 price. The 2012 price is the highest yearly average on record.
Yields were lower for 2012. For central Illinois high-productivity farmland, the average 2012 yield was 126 bushels per acre, down 48 bushels from the 2011 yield of 174 bushels per acre and down 61 bushels from the five-year average of 187 bushels per acre. Obviously, the 20132 drought lowered yields.
As a result of the drought, crop insurance proceeds were high and totaled $295 per acre. Crop insurance proceeds aided in covering yield losses caused by the drought.
Gross revenue totals $1,151 per acre in 2012. This was above 2011 revenue of $1,133. The 2012 revenue was the highest of the last five years. Higher prices and higher crop insurance proceeds offset the impact of lower yields.
Direct costs increased from $362 per acre up to $405 per acre. Direct costs include charges for fertilizer, pesticides, seed, drying, storage, and crop insurance. Notable increases occurred in fertilizer: $159 per acre in 2011 to $200 per acre in 2012. Fertilizer prices did not increase enough between 2011 and 2012 to account for this increase, suggesting that farmers applied more fertilizer, perhaps building phosphorus and potassium levels in the soil. Another notable increase was in seed costs: $96 per acre in 2011 to $108 per acre in 2012.
Power costs increased from $87 per acre in 2011 to $117 per acre in 2012. Leading power cost increases were increases in machinery depreciation from $39 per acre in 2011 to $55 per acre in 2012. This increase reflects relatively large capital expenditures on machinery in the past several years. Other power categories showing increases were machinery repairs ($17 per acre in 2011 to $22 per acre in 2012) and fuel and oil ($18 per acre in 2011 up to $23 per acre in 2012).
Overhead costs increased from $54 in 2011 up to $59 per acre in 2012.
Overall non-land costs increased from $503 per acre in 2011 to $581 per acre in 2012. More detail on these cost increases is provided here.
Operator and farmland return averaged $570 per acre in 2012, down from the $630 return in 2011.
Projections for 2013
Also included are projections for 2013. Revenue projections are made using an expected yield of 195 bushels for corn grown on high productivity farmland in central Illinois. A corn price of $4.90 is used in projections. The $4.90 projected price is above the $4.70 midpoint of WASDE projected prices, but is below current bids for harvest-time delivery. The $4.90 price presumes a normal crop which would lead to a reduction in corn prices.
Like what you're reading? Subscribe to Farm Industry News Now e-newsletter to get the latest news and more straight to your inbox twice weekly.
Non-land costs are projected at $563 per acre, down from the 2012 level of $581 per acre. This projection assumes reductions in fertilizer costs.
In this case, operator and farmland return is $415 per acre, down from levels in the last three years. The $415 return is a return before paying for farmland, which would equals cash rent for farmland that is cash rented. Cash rents vary considerably, but a $300 per acre cash rent occurs with some frequency. At a $300 cash rent, returns to the farmer would be $115 per acre.
Higher costs point to higher break-even price level. At a $300 per acre cash rent, total costs equal $863 per acre ($563 non-land costs + $300 land rent). At a 195 bushel yield, the break-even price is $4.43 per bushel ($863 total costs / 195 bushels per acre). Prices below $4.43 would result in negative returns.
Summary
While yields were down in 2012, operator and farmland returns were positive in 2012. Operator and farmland returns are projected lower in 2013 than in 2012.
You May Also Like
Enter a zip code to see the weather conditions for a different location.