
Subscribe to receive top agriculture news
Be informed daily with these free e-newsletters
July 31, 2012
The 2012 drought raises the possibility of crop insurance payments this year. An online tool for calculating insurance payments from COMBO products is available here. This tool will also calculate crop revenue, as well as sales and losses from any hedging. A similar tool is available in the 2012 Crop Insurance Decision Tool, which is a Microsoft Excel spreadsheet available for download here.
Online Crop Insurance What-If
The image below displays what you will see when you go to the link. In order to use the spreadsheet, click on the box in the upper right corner labeled “Click to Edit”. The user then can enter 1) crop insurance input which describes the crop insurance product, 2) harvest yield and price used to calculated insurance payments and crop revenue, and 3) hedging inputs used to calculate hedging gains or losses. In our example for corn, we have an RP policy at 80%, APH of 180 bu. per acre, harvest yield of 100 bu. per acre, harvest price of $7.50 per bu., harvest basis of -$0.20, and 90 bu. per acre hedged at a net cash price of $5.25 per bu.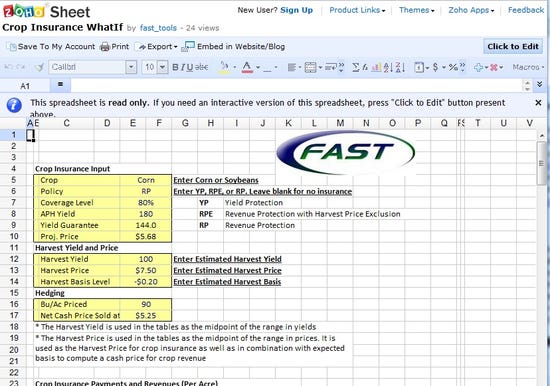
The spreadsheet contains four tables. The first table shows crop insurance payments and revenues, as illustrated below.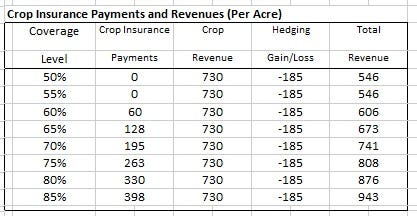
The above table shows crop insurance payments and revenues for different coverage levels:
1. Crop insurance payments show payments for the product selected. In the example, payments are based on Revenue Protection (RP) crop insurance at an 80% coverage level.
2. Crop revenue equals the harvest yield times the harvest prices minus the harvest basis level. In the example, crop revenue is $730 per acre which equal 100 bu. of harvest yield x $7.30 cash price ($7.50 harvest price - $.20 harvest basis level).
3. Hedging gain or loss. On each bushel that is priced, a hedging gain or loss is calculated equal to the net cash price sold at minus the cash price (harvest price minus harvest basis level). In the example, hedging gain is -$2.05 per bu. ($5.25 net cash price – ($7.50 harvest price - $.20 basis).
4. Total revenue is the sum of crop insurance payments plus crop revenue plus hedging gain/loss.
Three remaining tables show sensitivity analysis for crop insurance payments, crop revenues, and hedging gains/losses.
Summary
This tool will be useful in gauging per acre revenue from crop insurance, crop revenue, and marketing activities.
You May Also Like
Current Conditions for
34°F
Partly Sunny
Day 49º
Night 32º
Enter a zip code to see the weather conditions for a different location.


