Subscribe to receive top agriculture news
Be informed daily with these free e-newsletters

The efficacy and frequency of payments from a target price program with a fixed target price will depend on the relationship between the target price and expected long-run price. Crops whose target price is set closer to the expected long-run price will be expected to receive more payments.
June 5, 2012
A target price program that pays when national market year average price falls below a target price may be included as a choice for farmers in the next Farm Bill. Farmers would then be able to choose between the target price program and other revenue alternatives. In this post, an analysis is presented of the target price option contained in the Farm Bill proposal made as part of Super Committee deliberations last year. Frequency of payments will vary across crops because the relationship between the proposed target price and long-run price varies across commodities. A target price program would not necessarily make payments in years of low revenue.
Target prices and long-run prices
 Amount of price protection offered by a target price program depends on the relationship between the target price and long-run average price for a commodity. Target prices that are near or above the long-run average will provide more price protection than target prices that are further below the long-run average.
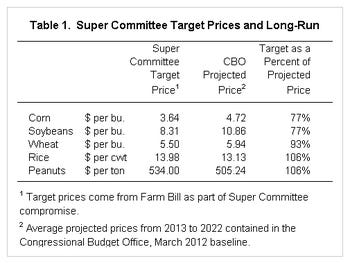
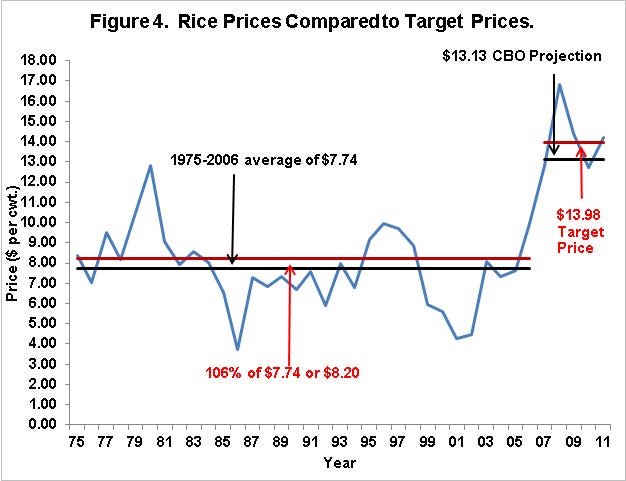
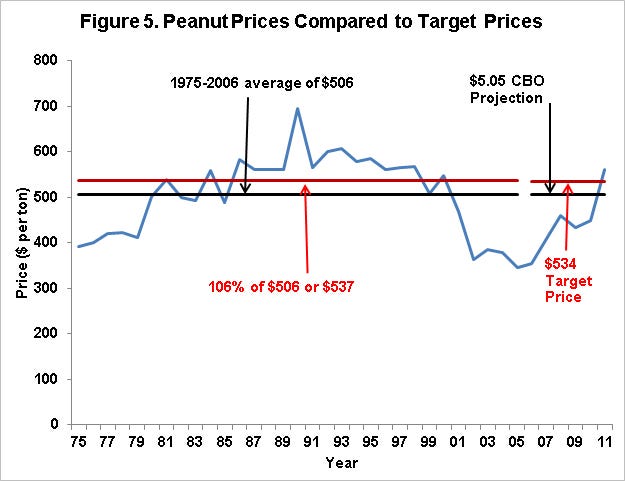
This is illustrated for corn, soybeans, wheat, rice and peanuts using target prices in the Farm Bill proposal made as part of Super Committee deliberations in 2011. This Farm Bill proposal was part of a general approach to reduce overall Federal spending that failed to pass. While not passing, target prices in the Super Committee proposal may be the starting point for setting target prices in future proposals. Super Committee target prices are $3.64 per bu. for corn, $8.31 per bu. for soybeans, $5.50 per bu. for wheat, $13.98 per hundredweight for rice, and $534 per ton for peanuts (see Table 1).
Long-run prices are approximated by prices used by the Congressional Budget Office (CBO) in its March 2012 agricultural baseline available here. Generally, these CBO projected prices are close to projected prices from USDA and other sources. Averages of yearly prices from 2013 through 2022 are $4.72 per bu. for corn, $10.86 per bu. for soybeans, $5.94 per bu. for wheat, $13.13 per hundredweight for rice, and $505.24 per ton for peanuts (see Table 1). Actual prices will vary around these long-run prices. For example, the $4.72 per bushel price for corn would indicate the likely average price for corn between 2013 and 2022. Some years the price will be above $4.72 and some years below $4.72, but the average for the 2012-2022 period likely is close to $4.72.
Target prices as a percent of projected prices indicate differences in target price relationships across crops. Corn and soybeans have values of 77%(see final column of Table 1). This would indicate that the market prices would have to fall 23% from the long-run averages before a target price program would make a payment. Target prices for the remaining crops are higher. Target prices as a percent of projected prices are 93% for wheat, 106% for rice, and 106% for peanuts. The 106% values indicate that the Super Committee target prices are above the CBO projected prices.
Frequency and timing of payments
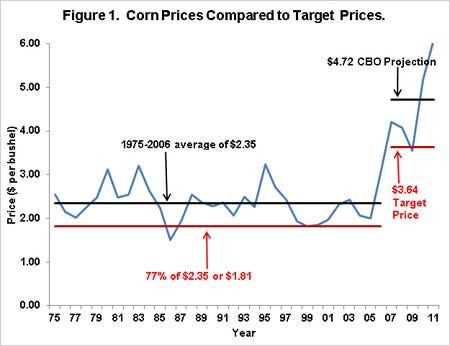 Historical variations in market year average prices can illustrate the frequency of payments from a target price program. Figure 1 shows market year average corn prices from 1975 through 2011. The 1975 through 2011 is divided into two time periods: pre and post 2006. Because of increased use of corn in biofuels and continued strong export demand for commodities, corn prices rose and generally have been viewed as reaching a higher level after 2006. For the same relative price as the current $4.72 CBO projection, the price would be lower from 1975 through 2006. There are two black lines in Figure 1. The first is from 1975 through 2006, giving the average corn price of $2.35 from 1975 through 2006. This $2.35 is the historical equivalent to the current $4.72 CBO projection. The second is since 2006 and equals the CBO projected price of $4.72. There are two red lines which are 77% of the black lines. The 77% is the target price as a percent of projected price shown in Table 1. For the period from 1975 through 2006, 77% of the $2.35 average is $1.81 per bu. The $1.81 represents a target price roughly equivalent to the proposed $3.63 target price, given that long-run prices changed in 2006. Note that the $1.81 is much lower than the target price in the 2002 and 2008 Farm Bills of $2.63 per bu. When the market year average price falls below the red line, payments likely would have resulted from the target price program like that proposed by the Super Committee.
As can be seen in Figure 1, a program having a target price that is 77% of the long-run average would have made payments in four years: 1986, 1999, 2000, and 2009. These four years represent 11 percent of the years. The first three of these years would have been period of financial stress. However, 2009 generally is not recognized as a financial stressful year for corn producers.
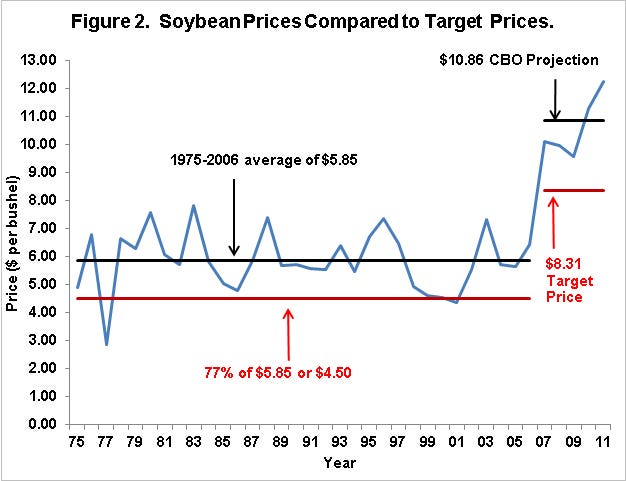
Similar analyses for soybeans, wheat, rice, and peanuts are respectively shown in Figures 2 through 5. Summary comments are:
Soybeans: Having a target price that is 77% of long-run price results in payments in two years. This represents a payment in 5% of the years.
Wheat: Having a target price that is 93% of long-run price results in payments in 12 years. This represents a payment in 32% of the years.
Rice: Having a target price that is 106% of long-run price results in payments in 23 years. This represents a payment in 62% of the years.
Peanuts: Having a target price that is 106% of long-run price results in payments in 20 years. This represents a payment in 54% of the years.
Summary
The efficacy and frequency of payments from a target price program with a fixed target price will depend on the relationship between the target price and expected long-run price. Crops whose target price is set closer to the expected long-run price will be expected to receive more payments.
As illustrated with corn payments, a target price does not necessarily make payments in years in which financial stress is occurring. A target price program does not include yields in its calculations. Hence, revenues may not be down in years when prices are low and vice versa.
The above analysis assumed we could accurately predict future long-run prices. While the CBO prices used in the above projections generally are within the consensus, conditions can change that will change estimates of long-run prices. This presents issues when attempting to pick a fixed target price given that structural changes may occur in agriculture.
You May Also Like
Enter a zip code to see the weather conditions for a different location.


