Subscribe to receive top agriculture news
Be informed daily with these free e-newsletters

This post is the second in a series that will contrast and compare the farm prosperity of the 1970s with the current period of farm prosperity. This post examines U.S. net cash farm income and U.S. farm real estate values during the two periods.
April 8, 2013
Overview
This post is the second in a series that will contrast and compare the farm prosperity of the 1970s with the current period of farm prosperity. This post examines U.S. net cash farm income and U.S. farm real estate values during the two periods. The previous post, titled, "Comparing Current and 1970 Farm Prosperity: Crop Prices," is available here.
Analysis
This article uses 3 variables: (1) U.S. net cash farm income, which equals cash farm income minus cash farm expenses; (2) value of U.S. farm real estate, which includes land and buildings; and (3) U.S. Gross Domestic Product (GDP) price deflator. Economists commonly use the GDP price deflator as a broad measure of price inflation in a nation's economy. The data on net cash income and farm real estate are from the U.S. Department of Agriculture (USDA), Economic Research Service while the data on GDP deflator are from the Federal Reserve Bank of St. Louis.
The two periods examined are 1973 through 1981 and 2006 through 2012. The earlier period ends with 1981 because this is the year in farm real estate began to decline, which is often taken as the end of the 1970 period of prosperity. Therefore, there are more years in the earlier period than in the current period: 9 vs. 7 years. Other alternative periods exist, but these are reasonable periods to provide an initial comparison. The income and real estate values for 2012 are estimates and are likely to be revised.
Net cash farm income
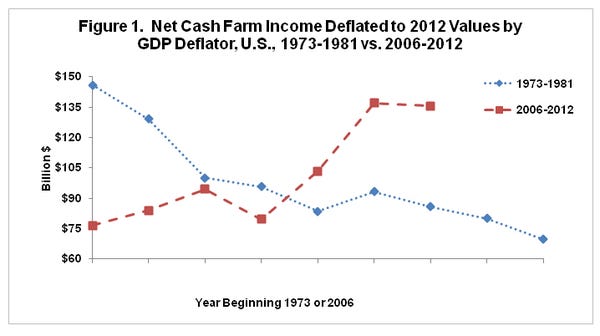
Deflated net cash farm income in 2012 dollars averaged nearly the same during the first 7 years of both the 1970 and current periods of farm prosperity: $105 billion per year (1973-1979) vs. $102 billion per year (2006-2012). Moreover, the highest deflated net cash farm income is similar in the two periods (see Figure 1): $146 billion (1973) vs. $137 billion (2011). Despite these similarities, deflated net cash farm income generally declined over the 1973-1981 period but generally increased over the 2006-2012 period. Thus, deflated net cash farm income during the current period of farm prosperity did not approach the 1973 peak until recently. The difference in time paths of deflated net cash farm income is similar to the difference noted in the previous post in the time path of crop prices received by U.S. farm.
Farm real estate
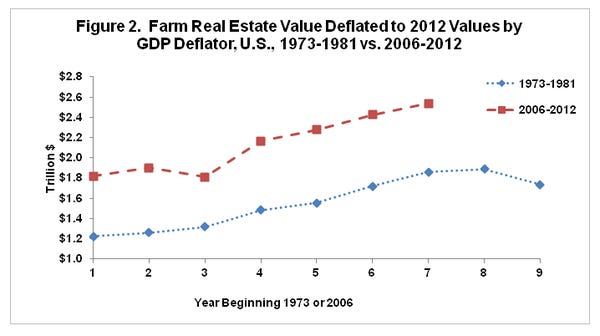
The value of deflated farm real estate in 2012 dollars at the beginning of the current period of farm prosperity was nearly 50% higher than at the beginning of the 1970 period of farm property: $1.8 trillion (2006) vs. $1.2 trillion (1973) (see Figure 2). Despite these different starting values and the different time paths of deflated net cash farm income, farm real estate has increased at a similar rate in the two periods. At the end of the 7th year in the first period (1979) the cumulative increase in U.S. deflated farm real estate was 87%. By the end of the 7th year of the current period of farm propensity (2012), the cumulative increase in U.S. deflated farm real estate was 77%.
Ratio of farm real estate to net cash farm income
Figure 3 presents the ratio of the value of farm real estate to net cash farm income. This ratio is calculated because of the notably different time paths in net cash farm income during the 1970 and current period of farm prosperity. Unsurprisingly, this ratio also exhibits different time paths. During the 1970 prosperity, the ratio consistently trended upward. In 1973, farm real estate was 8.4 times net cash farm income. By 1981, farm real estate was 24.9 times net cash farm income. In contrast, no trend is apparent in this ratio during the current period of farm prosperity. The ratio has fluctuated around its average value of 21.6.
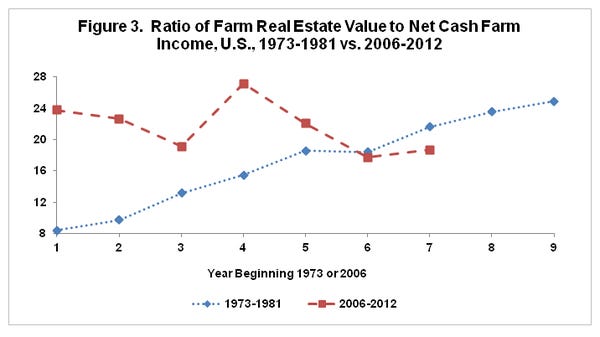
Different ratios of farm real estate to net cash farm income existed at the beginning of the 1970 and current periods of farm prosperity. During the 5 years preceding 1973, the ratio averaged 11.5. During the 5 years preceding 2006, the ratio averaged 16.8. Despite these different starting values, by the end of the 1970s farm prosperity, the ratio of farm real estate to net cash farm income had reached the current levels of this ratio. It is important to point out that it is not clear why the ratios differed in these two five year periods, but the difference is likely due to several factors.
Summary Observations
This set of observations on net cash farm income and farm real estate underscores that both similarities and differences exist between the two most recent periods of U.S. farm prosperity. One of the most important questions going forward is whether the similarities or differences are more important in determining how the current period of farm prosperity will evolve.
In retrospect, the 1970 period of farm prosperity can be characterized broadly as an asset driven period of prosperity, likely initiated by a very brief period of extremely high farm income. The current period of farm prosperity appears to broadly be a period of farm income driven prosperity, with farm real estate values being driven by farm income. In short, this examination suggests that it is more important to watch changes in farm income than farm real estate values as an early warning signal for trouble emerging during the current period of farm prosperity.
The need to pay attention to early warning signals has increased in importance as the current period of farm prosperity approaches the length of the 1970 period of prosperity. This is not a prediction that the current period is going to end soon, but those who fail to pay attention to history are often doomed to repeat it.
Since we do not yet know how the current period of prosperity will play out, all observations are based on partial information. Nevertheless, this article suggests an interesting question: given the stability in the ratio of farm real estate to net cash farm income during the current prosperity, if farm income would decline permanently would farm real estate values decline at the same time or, similar to historical experience, decline with a lagged delay? Answering this question will depend on understanding what underpins the different ratios between farm real estate values and net cash farm income that have been observed historically.
In summary, this examination suggests that there are two important questions that will help drive the evolution of the current period of farm prosperity. Question 1: What is the level of real (deflated) net cash farm income. To state the question somewhat differently, is the long term value of net cash farm income closer to its historical average since 1972 of $78 billion per year or to its average of $88 billion per year since 2006? Question 2: What is the underlying, long term ratio of farm real estate to net cash farm income? To state this question somewhat differently, is the long term value of this ratio closer to its historical average since 1972 of 16.3 or its average of 21.6 since 2005? Before examining these questions, the next farmdoc post in this series will compare and contrast the time paths of farm debt during the 1970 and current period of farm prosperity.
This publication is also available at http://aede.osu.edu/publications.
You May Also Like
Enter a zip code to see the weather conditions for a different location.


