Subscribe to receive top agriculture news
Be informed daily with these free e-newsletters

Shown are yields for corn and soybeans, stated as a percent of APH, below which insurance payments will be made in 2011 under each of three plans within the Risk Management Agency's COMBO product. The East Crop Reporting District (CRD) has the lowest relative yields. Insurance payments are most likely in this CRD.
November 9, 2011
Last week, the Risk Management Agency (RMA) announced harvest prices for corn and soybean grown in the Midwest. The harvest price for corn is $6.32 per bu., $.31 per bu. higher than the $6.01 projected price. The harvest price for soybeans is $12.14 per bu., $1.35 per bu. below the $13.49 projected price.
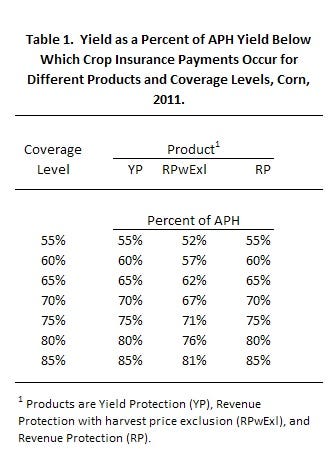
Table 1 shows corn yields, stated as a percentage of the Actual Production History (APH), below which insurance payments will occur under each of the three plans within the COMBO product. Under Yield Protection (YP) at an 85% coverage level, payments will occur when yield is below 85% of the APH yield (see Table 1).
Similar to YP, yield must be below 85% of APH yield under Revenue Protection (RP) at the 85% coverage level. Since the harvest price is above the projected price for corn, RPs guarantee increases, resulting in the need for a yield loss before an insurance payment is received. When the harvest price is above the projected price, both YP and RP require the same yield loss to trigger payments.
RP with Exclusion (RPwExl) does not use the higher of projected or harvest price in its guarantee. As a result higher yield losses are required when the harvest price is above the projected price. At an 85% percent coverage level, RPwExl requires yields to be less than 81% of the APH yield, compared to 85% for YP and RP.
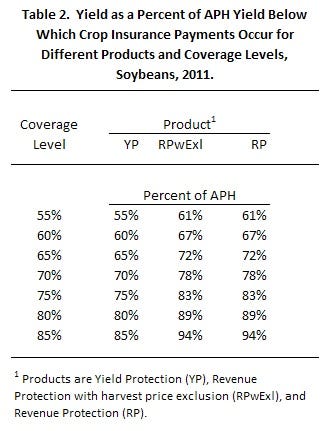
Soybean harvest price is below the projected price. As a result, revenue will be lower because of price declines, requiring less of a yield loss before insurance payments occur. At an 85% coverage level, RPwExl and RP require yields to be less than 94% of the APH yield (see Table 2). Both RPwExl and RP have the same guarantee when harvest price is below the projected price, resulting in both requiring the same yield loss before payments occur. As will always be the case no matter the harvest price relative to the projected price, YP with an 85% coverage levels requires that yields be lower than 85% of the APH yield.
Projected Crop Reporting District (CRD) yields for 2011 give indications of where farms are more likely to receive insurance payments. The 2011 projected yield is taken as a percent of the 10-year average to show the current year’s yield relative to historic yields. A lower percent indicates the more crop insurance payments likely will occur in that CRD.
For corn, four of the CRD’s 2011 yield is at or above the 10-year average (see Table 3): Northwest (107%), Northeast (103%), East Southeast (101%), and Southeast (100%). Four districts are in the 90% range: West (99%), Central (96%), West Southwest (99%), and Southwest (99%). The East CRD had a 2011 yield that is 85% of the 10-year average. Given its low relative yield, more farms likely will receive insurance payments in the East CRD.
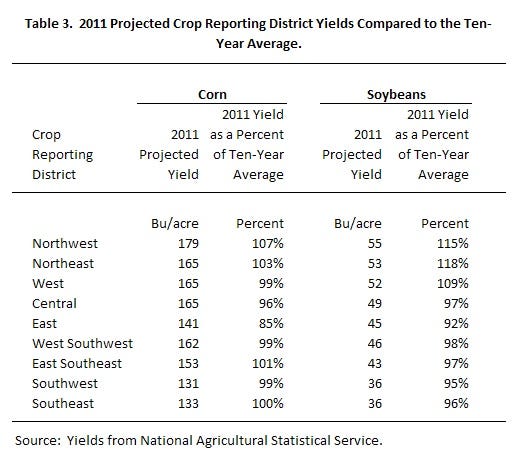
For soybeans, the northern Illinois had yields significantly above the 10-year average: Northwest (115%), Northeast (118%), and West (109%). The Central and Southern portions of the state have 2011 yields relative to the 10-year average in the 90% range. The East CRD had the lowest relative yield of 92% (Table 3). The 92% is close to the trigger level for insurance payments (see Table 2). Again, insurance payments for soybeans are more likely for farms in the East CRD compared to CRDs with higher relative yields.
This post shows yields stated as a percent of APH yield below which insurance payments will be made in 2011 for corn and soybeans. The East CRD has the lowest relative yields. Insurance payments are most likely in this CRD.
You May Also Like
Enter a zip code to see the weather conditions for a different location.


