Subscribe to receive top agriculture news
Be informed daily with these free e-newsletters

Farmers will find the premium reductions of benefit, reducing the costs of insurance. How farmers react to this change is an open question. Some farmers may keep the same coverage level at a lower cost. Other farmers may choose to increase coverage level since the cost of insurance will be reduced.
January 18, 2012
The Risk Management Agency (RMA) undertook a study of corn and soybean premiums and found that insurance premiums were too high relative to insurance payments (see here). As a result, RMA adjusted corn and soybean premiums. In addition, RMA implemented other adjustments that changed premiums, with one of those adjustments relating to enterprise units. In this article, 2011 Revenue Protection (RP) farmer-paid premiums are compared to 2012 premiums for corn and soybean policies in Illinois.
Approach
One set of RP premiums is generated for each county in Illinois. These premiums are for RP without the Trend Adjustment (TA) Endorsement for 2012 premiums. Even though most farmers will take the TA Endorsement, premiums without the TA adjustment are used here to ensure proper comparison between 2011 and 2012. For 2011 premiums, premiums without the Biotech Endorsement are used. Use of the Biotech Endorsement would reduce premium reductions shown below.
For each county, premiums are generated for an Actual Production History (APH) yield equal to the average of county yields from 2001 through 2010. RP premiums are shown for coverage levels from 65% up to 85% for four different unit/acre combinations:
Optional units,
Basic units with 300 acres,
Enterprise units with 300 acres, and
Enterprise units with 450 acres.
 Premiums for both 2011 and 2012 are generated using 2011 prices and volatilities:
Corn: $6.01 projected price and a .29 volatility, and
Soybeans: $13.49 projected price and a .23 volatility.
Using the same projected prices and volatilities allows the impacts of rate changes to be isolated. Premiums on 2012 policies will vary from those used here as 2012 projected prices and volatilities will vary from 2011 levels. Higher projected prices or volatilities will result in higher 2012 premiums and vice versa.
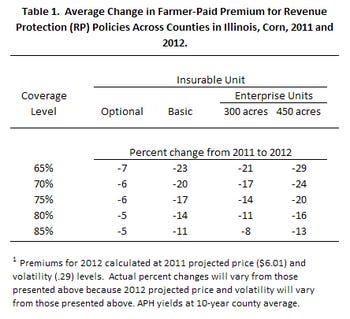
Table 1 reports average changes for different coverage levels and unit choices. These changes represent simple averages of premium changes across counties.
Corn
Average RP premiums are reduced 7% for 65% coverage levels. Premium reductions decline to 5% for 85% coverage levels (see Table 1). These reductions on optional units primarily represent the impacts of rate changes to correct for too high of premiums relative to payments.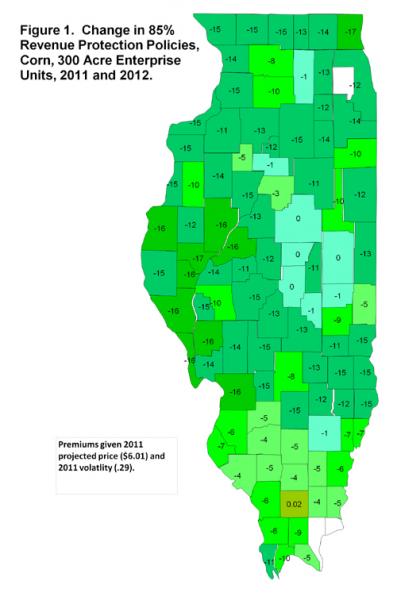
On average, basic units had higher premium reductions than for optional units. Basic premium changes range from a 24% reduction for the 65% coverage level down to a 10% reduction for an 85% coverage level (see Table 1). Enterprise units also showed larger reductions. Enterprise units with 300 acres have average reductions of 21% for the 65% coverage level, with reductions reduced to 8% for the 85% level. Average reductions are higher for the 450-acre enterprise unit, ranging from a 29% reduction for the 65% coverage level to a 13% reduction for the 85% coverage level.
Reductions varied across counties, as illustrated in Figure 1 which shows percent changes for 300-acre enterprise units. The largest reductions occur in western Illinois. Eight counties in western Illinois had reductions over 15%: Brown (16% reduction), Calhoun (16%), Fulton (16%), Greene (16%), Hancock (16%), Madison (16%), Mason (16%), Pike (16%), and Schulyer (17%) Counties. In addition, Lake County in northeast Illinois had 17% reduction, exceeding the 15% reduction mark. The lowest reductions occur in east-central Illinois: Champaign (0% reduction), DeWitt (0%), Macon (0%), and McLean (0%) Counties. Williamson County in southern Illinois has a 2% increase.
Soybeans
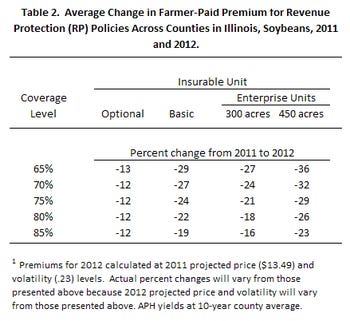 For optional units, average reductions for soybeans range from 13% for the 65% coverage level to 12% for the 85% coverage level (see Table 2). On average, soybean policies receive more premium reductions than for corn. At an 85% coverage level, the average reduction for a soybean optional unit was 12%, compared to a 5% reduction for corn.
Like corn, premium reductions for soybeans are larger for basic and enterprise units. At an 80% coverage level, the reduction is 12% for an optional unit compared to 22% reduction for the basic unit, 18% reduction for the enterprise unit with 300 acres, and a 26% reduction for an enterprise unit with 450 acres
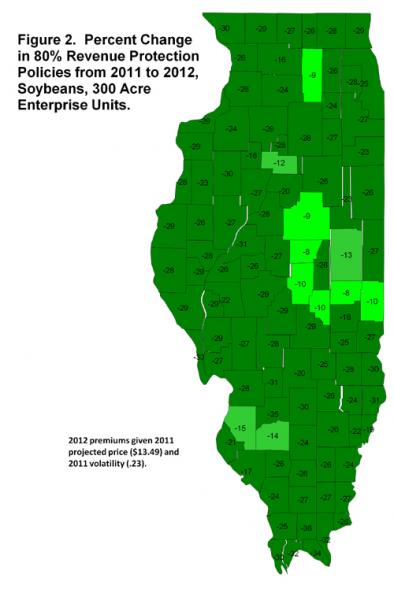
Figure 2 shows premium changes for an 80% coverage level RP policy. Most counties had premium reductions over 15%. Four counties had premium reductions below 10%: DeKalb (9% reduction), DeWitt (8%), Douglas (8%), and McLean (9%) Counties.
Summary
 RMA re-ratings efforts generally result in lower premiums for Illinois farmer. These re-ratings efforts seem justified given the relatively low payments on corn and soybean policies compared to insurance premiums. This re-rating likely will bring loss performance closer in line with legislative target, although resulting loss experience likely will require further premium reductions to totally bring premiums in line with legislative targets.
Farmers will find the premium reductions of benefit, reducing the costs of insurance. How farmers react to this change is an open question. Some farmers may keep the same coverage level at a lower cost. Other farmers may choose to increase coverage level since the cost of insurance will be reduced.
Also available at:
http://farmdoc.illinois.edu/manage/newsletters/fefo12_01/fefo_12_01.html
You May Also Like
Enter a zip code to see the weather conditions for a different location.


