
Subscribe to receive top agriculture news
Be informed daily with these free e-newsletters
November 21, 2012
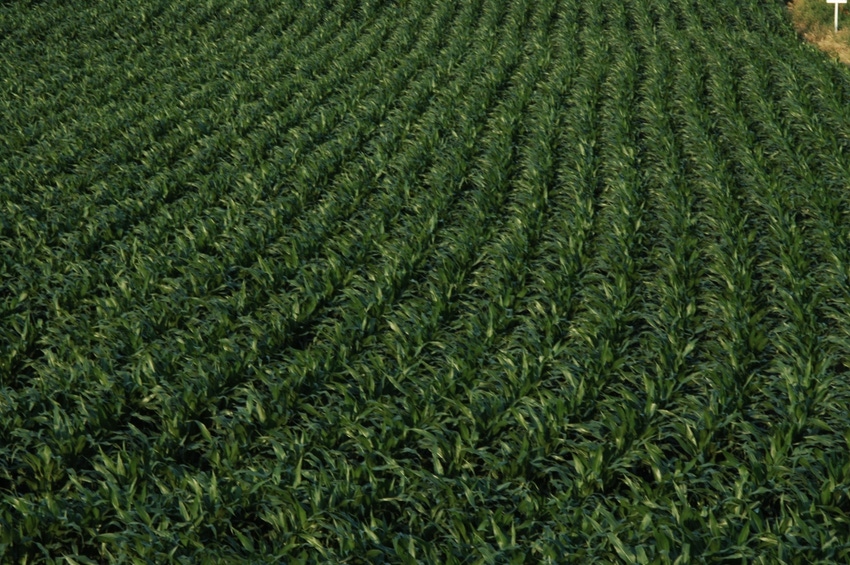
Current futures prices suggest harvest-time 2013 prices of $5.80 per bu. for corn and $12.40 per bu. for soybeans. Given these prices, 2013 farm incomes likely would be above average. Worst case incomes depend on levels of projected prices used to set crop insurance guarantees. Likely projected prices will provide significant downside revenue protection. To quantify income projections, farm incomes for a 1,200 Illinois grain farm are simulated and presented.
Farm situation
Net farm income is simulated for the following farm designed to be representative of commercial grain farms in Illinois:
The farm has 1,200 acres.
Expected yields are 187 bushels per acre for corn and 54 bushels per acre for soybeans, with two-thirds of acres in corn and one-third in soybeans.
The farm owns 120 acres, share-rents 360 acres, and cash rents 720 acres. This represents the typical tenure/rental situation for farms in northern and central Illinois.
Cash rent is $300 per acre.
Farm costs are specified at levels contained in 2013 crop budgets.
The farm has $480,000 of debt.
Projected 2013 net farm income
Current forward contract bids for 2013 harvest time delivery are $5.80 per bu. for corn and $12.40 for soybeans. Given these commodity prices, net farm income is projected at $291,000 (see Table 1). This income would be high relative to averages. Farms of this size have average income around $207,000 for the years from 2007 through 2011.
Slightly lower price projections of $5.40 for corn and $11.80 per bu. for soybeans would result in $229,000. Income projections at this level would still be above average.
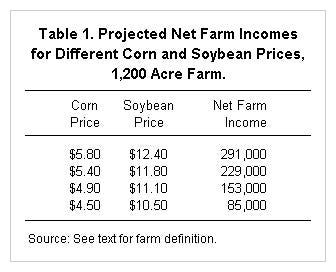
Price over the next five to ten years likely will average considerably lower than the $5.80 corn price and $12.40 soybean price indicated by current futures prices. Estimates of average, or long-run, prices are $4.50 per bu. for corn and $10.50 per bu. for soybeans. These long-run prices result in $85,000 of net farm income (see Table 1).
Worst case net farm incomes
Net farm incomes could be considerably lower than projected above. To gain a feel for downside risks, worst case incomes are determined given the following:
Revenue Protection (RP) at the 80% coverage level is purchased for both corn and soybeans. Lower coverage levels would result in lower worst case incomes.
Trend Adjusted Actual Production History (TA-APH) yields are 180 bu. for corn and 50 bu. for soybeans.
Projected prices used to set crop insurance guarantee are set at $6.10 for corn and $12.70 for soybeans. These projected prices will be determined at the end of February and have a critical importance in limiting downside revenue. Lower projected prices will lower worst case net farm income scenarios.
Costs are assumed to remain constant and lower incomes result from lower revenues.
Given the above, the worst case income is $43,000. A number of price-yield combinations can results in this $43,000 income. Holding yields constant at 187 bu. per acre for corn and 54 bu. for soybean, the $43,000 worst case income would result with a $4.40 corn price and $9.10 soybean price.
Again, projected price used for crop insurance have a large impact on worst case incomes. Worst case incomes for lower projected prices are:
-$5,000 for projected prices of $5.70 for corn and $12.10 for soybeans, and
-$64,000 for projected prices of $5.20 for corn and $11.40 for soybeans.
Worst case income also depends on coverage level selected. For a $6.10 projected corn price and $12.70 projected soybean price, worst case incomes for different coverage levels are:
$92,000 for an 85% coverage level (both corn and soybeans),
$43,000 for an 80% coverage level,
-$5,000 for a 75% coverage level,
-$53,000 for a 70% coverage level, and
-$101,000 for a 65% coverage level.
Amount of land cash rented and cash rent level also impacts worst case incomes. Impacts of rental arrangements on projected incomes will be examined in a farmdoc daily post next week.
Summary
Current price projections at harvest time in 2013 place prices at $5.80 for corn and $12.40 for soybeans. These prices likely would result in above average 2013 net farm income. These projected 2013 income also would be considerably above income projected using long-run prices. Overall, 2013 currently is projected as a good income year for crop farms. Worst case incomes will be influenced by projected prices and coverage level choices. Likely projected prices will provide significant downside risk protection given that relatively high crop insurance coverage levels are selected.
You May Also Like
Current Conditions for
54°F
Mostly Cloudy
Day 64º
Night 51º
Enter a zip code to see the weather conditions for a different location.


